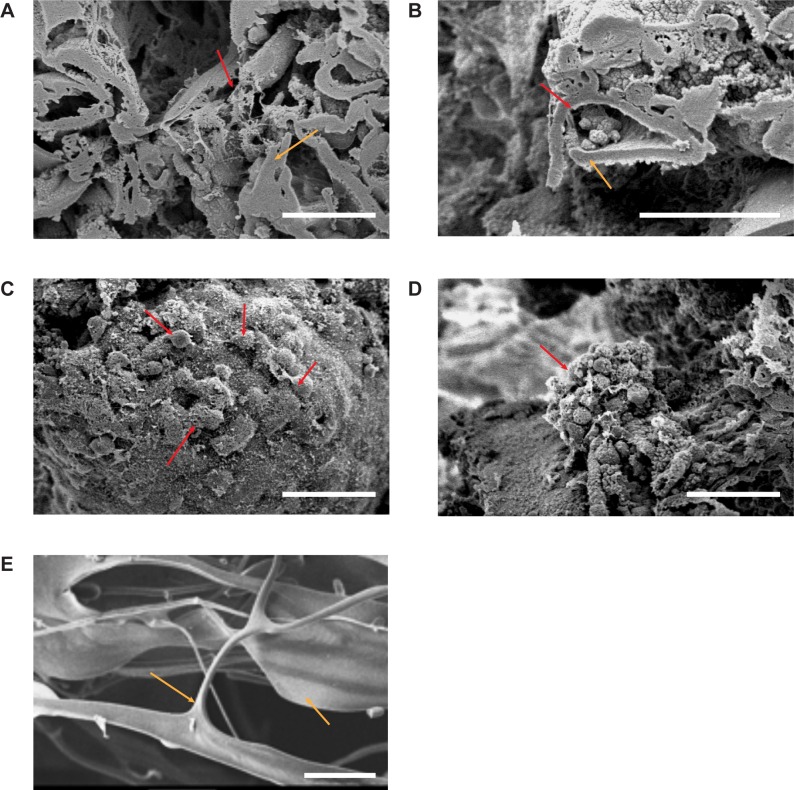
Fig 3. SEM images of acellular and cellular CM3D.
A) Interior, cross sectional surfaces produced by freeze fracture of acellular CM3D, showing the interaction between HA (red arrow) and CT (orange arrow) on Day 21 (Original Magnification 700X). B) Interaction of cells with CM3D on Day 28. Cells within CM3D (red arrow) grow inside the crevices created by the formation of HA-CT fibers (Orig. Mag. 1000X). C) Interaction of cells and CM3D on day 21. Cells are spread out on the periphery (red arrow) of CM3D while some cells appear to be interacting with one another (700X). D) Cell to cell interaction as an aggregate cell mass (red arrow) attached to the periphery of CM3D (700X). E) CT only shard imaged prior to being blended with HA. This image was taken on its surface. The white scale bar for all images is 50μm in length.

