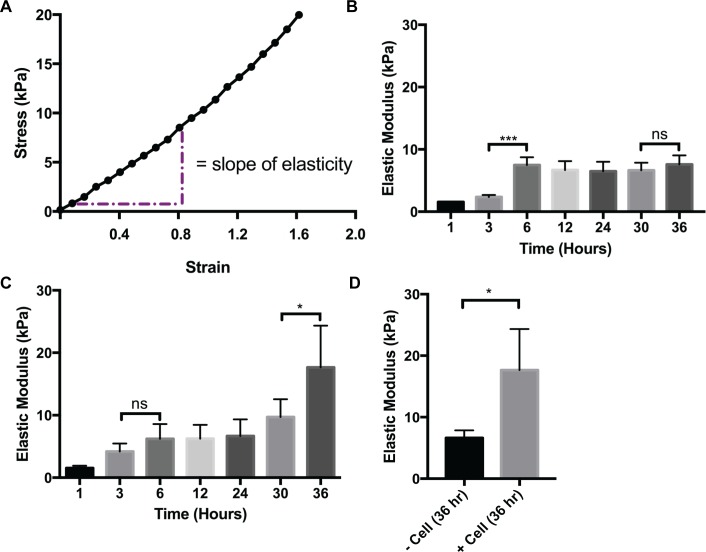
Fig 5. Mechanical Properties Analysis of CM3D.
A) Region of elastic modulus for CM3D stiffness. B) Graph representing acellular (- cells) CM3D stiffness. C) Graph representing cellular (+ cells) CM3D stiffness. D) Graph representing acellular and cellular CM3D stiffness at hour 36. To determine the statistical significance between acellular and cellular CM3D respectively, the one-way ANOVA/Kruskall–Wallis test was performed followed by a Dunn’s Multiple Comparison post hoc test. The student’s t-test was performed to determine the statistical significance between acellular and cellular CM3D stiffness at hour 36, a student’s t-test was performed. Values indicate average stiffness or modulus values, and ±SD of n = 4 repeats.

