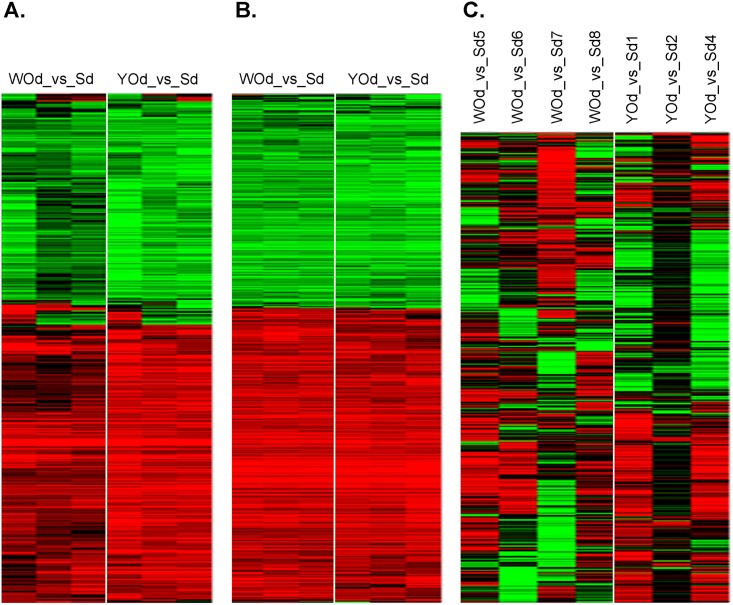
Fig 1. Unsupervised hierarchical clustering of genes altered by exposure to white onion or yellow onion digest.
Genes were selected on > 1.5-fold up- or downregulation by WOd (WO_Dig) or YOd (YO_Dig) in at least 3 out of 6 (Caco-2 and rat intestine) or 7 (SISP) arrays. This resulted in 429, 766 and 713 genes for heatmaps of human Caco2 cells (A), rat intestine slices (B) and the porcine SISP model (C), respectively. Red: upregulation, green: downregulation, black: not affected. A ≥ 2-fold up- or downregulation obtained a maximal colour. The expression data for the three models (in 2log values of onion digest vs. saline digest) are provided are provided in S1, S2 and S3 Tables.

