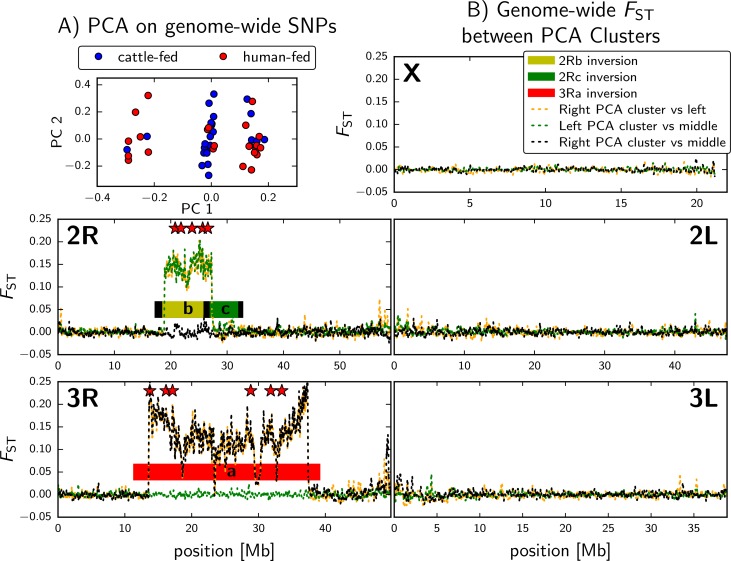
Fig 2. Genetic variation explained by the 2Rb and 3Ra inversions.
a) Genetic structure was assessed using genome-wide SNP data for individual An. arabiensis females using a PCA analysis. Three discrete PCA clusters were observed. Red = human-fed and blue = cattle-fed. There is an enrichment of cattle-fed individuals in the middle PCA cluster (P < 0.001; Fisher Exact). (b) To reveal differentiated genomic regions underlying the distinct PCA clusters (left, middle, and right) we plotted FST for each chromosome in 100kb windows with 20kb steps between the PCA clusters. The outside PCA clusters differed at the 2Rb and 3Ra inversions (orange), left versus middle PCA clusters differed at 2Rb only (green), and right versus middle differed at 3Ra only (black). Stars indicate the position of SNPs chosen for the inversion genotyping assay.

