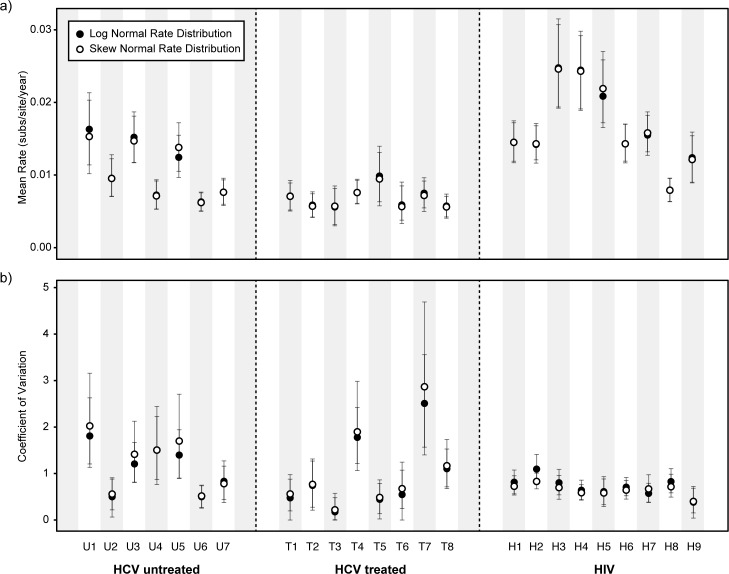
Fig 2. Estimation of evolutionary rates.
(a) Estimated mean viral evolutionary rate for each subject in the three groups (HCV untreated, HCV treated, and HIV). (b) Estimated coefficient of variation (COV) of the relaxed molecular clock, for each subject. Filled circles indicate estimates obtained under a molecular clock with a log-normal distribution of among-branch rates. Open circles indicate estimates obtained under a molecular clock with a skew-normal rate distribution of among-branch rates. The 95% highest posterior density (HPD) intervals for each estimate are indicated by vertical error bars.

