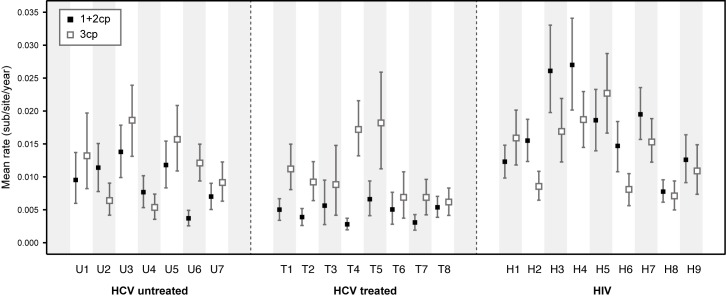
Fig 3. Estimation of evolutionary rates for codon partitions.
Evolutionary rates for the two codon partitions (1+2 cp and 3cp) were estimated separately for each subject. Black squares indicate the mean evolutionary rate for 1+2cp sites, and white squares indicate the mean evolutionary rate for 3cp sites. The 95% HPD intervals for each estimate are indicated by vertical error bars.

