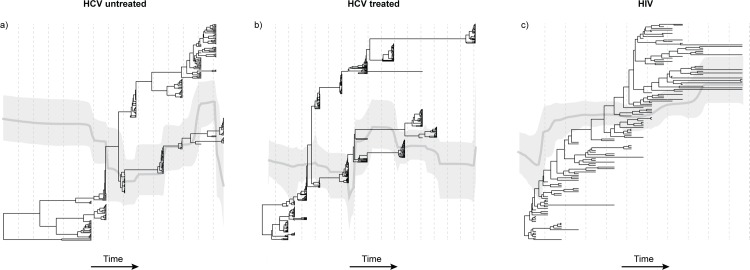
Fig 4. Phylogenetic structure.
A maximum clade credibility phylogeny is shown for one representative subject from each patient group (HCV untreated, HCV treated, and HIV). Branches are scaled by time. Superimposed on each phylogeny, on the same timescale, is the estimated Bayesian skyline plot for that subject. The light grey line indicates the mean skyline plot estimate of effective population size through time. The darker grey areas indicate the 95% highest posterior density credible interval for that estimate. The distance between dotted vertical lines indicates one year. (a) Patient U3 from the HCV untreated group. (b) Patient T1 from the treated HCV group. (c) Patient H2 from the HIV cohort.

