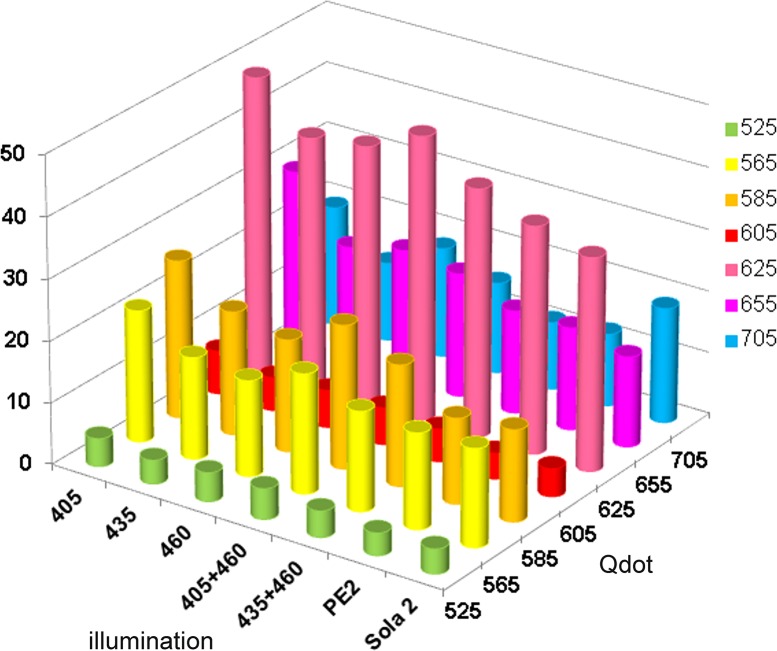
Fig 7. Specific fluorescence ratio when excitation Qdots various LED illumination system.
The intensity of fluorescence at the peak of emission for each Qdot was recorded in macrophages labelled with antiCD68 and a secondary antibody conjugated with the indicated Qdot. The intensity of autofluorescence at the same wavelength was obtained from an unstained slide. The figure shows the specificity of fluorescence for each Qdot, illuminated with PE4000 at 405nm (405); 435nm (435); 460nm (460), simultaneous illumination with 405 and 460nm (405+460), 435+460 (435+460), PE2 and Sola2. The crude data are given in Table 5C.

