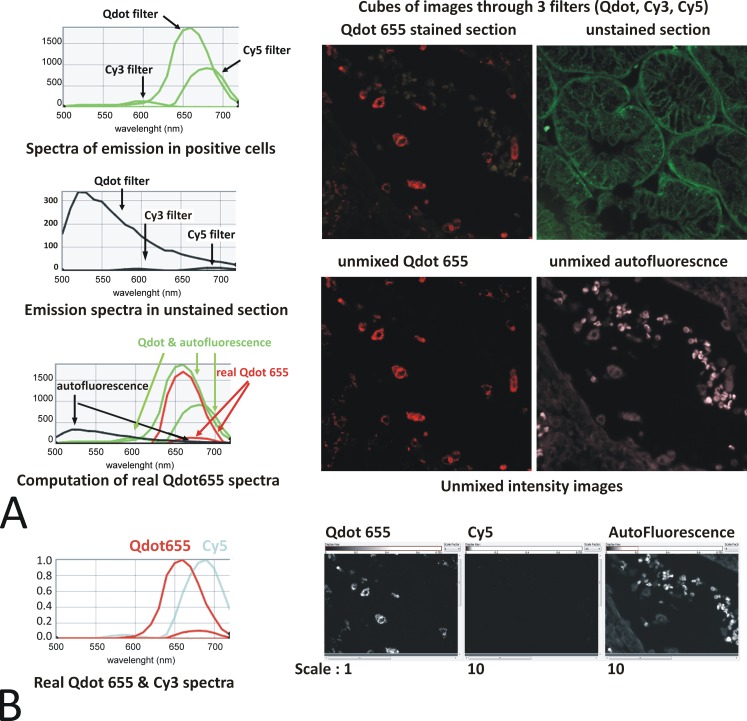
Fig 11. Qdot 655 imaged under Qdot, Cy3 & Cy5 conditions.
Evidence of bleed through in Cy3 filter and resolution with spectral unmixing. A: A Qdot 655 single color immunofluorescence and an unstained kidney section were imaged with LED single wave lengths PE 4000 435, 550 & 635nm through the Qdot, Cy3 & Cy5 filter set respectively. The resulting cubes of images are shown in the top panel. The spectra of emission in the positive cells (Qdot 655 + autofluorescence–green curves) and the autofluorescence (black curves) were obtained, and the real Qdot655 was mathematically computed (red curves) using the Nuance software [13]: A peak of emission remains in the real Qdot spectra corresponding to genuine bleed through of Qdot 655 in the Cy5 filter. Note the presence of fluorescence in the Cy5 filter suggesting bleed through (the curve highs are dependent upon the exposure time of the image and thus do not reflect the intensity of the fluorescence). The Nuance spectral analysis software uses the spectral information from all 3 filters used to unmix a real Qdot 655 intensity image from the autofluorescence (bottom panel). B: A Cy5 stained section was used to similarly compute the real Cy5 spectra when imaged through the 3 filters (cyan curves). When this spectra, together with the real Qdot655 (red curve) & autofluorescence spectra are used to unmixed a Qdot655 single stained section, appropriately, no fluorescence is assigned to Cy5: Spectral unmixing can resolve the bleed through that a normal fluorescence system would not. Note the autofluorescence and Cy5 intensity images have been scaled up 10 fold to help visual assessment of the absence of fluorescence.

