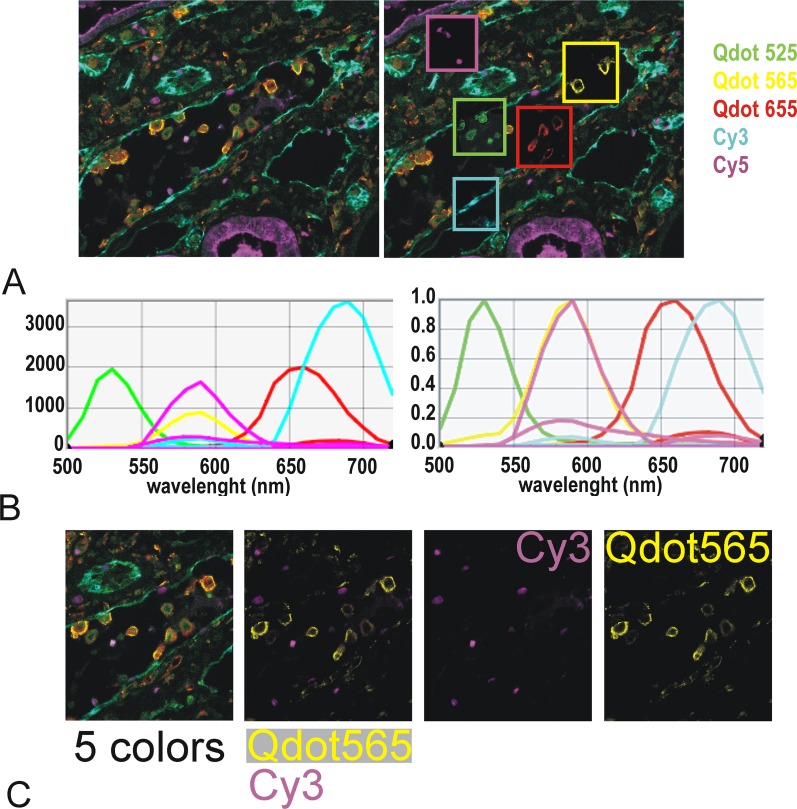
Fig 12. 5-color multiplex using Qdot525, 565, 655 & Cy3 & Cy5.
The stained FFPE section, illuminated with PE4000 single wave lengths (LAMs 435nm, 550 &635 nm) was imaged using Nuance Fx tunable camera between 500 & 720 nm through Cy3, Cy5 & Qdot filter cubes. The cube of images was unmixed according to single color spectra. A: left: unmixed image with all makers superimposed; false colors as indicated; right: same unmixed image showing in windows the individual unmixed markers. B: spectral library used for the unmixing. Left: scaled to max; right normalised. The resulting spectra take into account the emission of each fluorophore in each cube. The intensities of the dyes are of similar levels with Cy3 being about twice as bright as the other dyes (left). Note that although Cy5 & Qdot 585 have a similar peak of emission (yellow & magenta–right panel) Qdot 565 does not bleed through Cy3 filter (2 magenta curves for emission of Cy3 in both the Qdot & the Cy3 filter but only one yellow curve for emission of Qdot 565 in Qdot filter). C: cube (5 colors) and unmixed images showing an excellent unmixing of Cy3 (Ki 67 staining in few nuclear cells) and Qdot565 (CD68 staining in macrophages)

