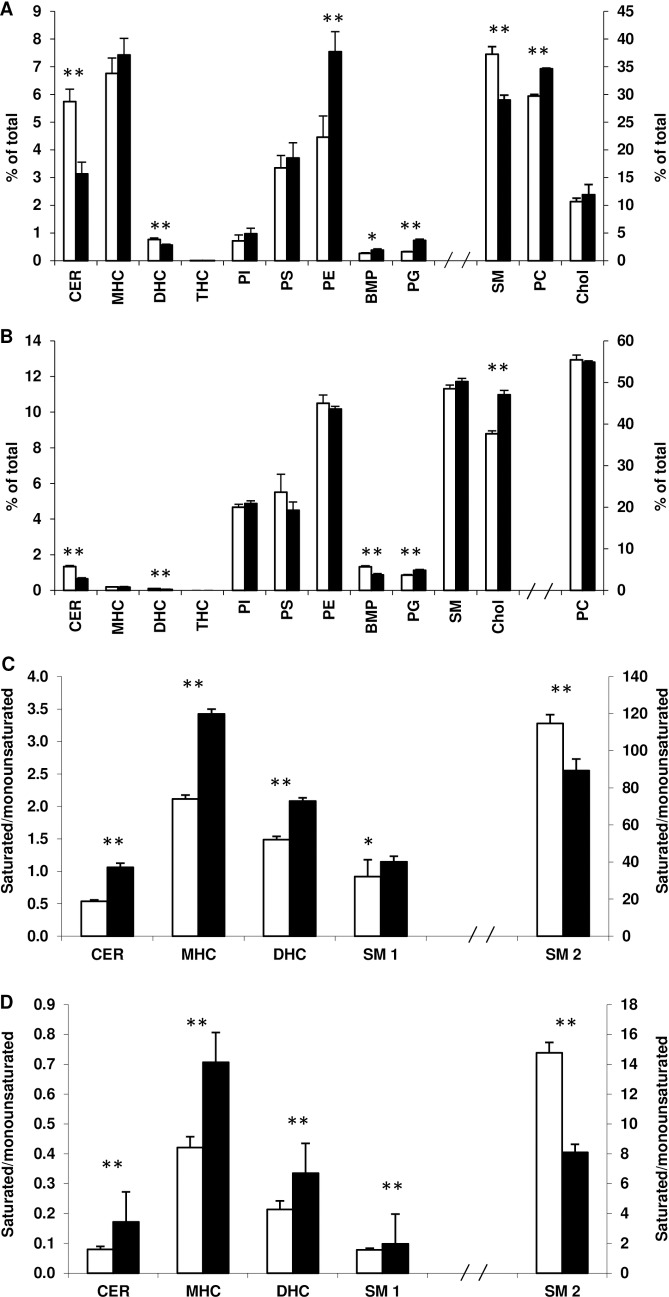
Fig 4. Lipid composition of membrane microdomains in control and SCD1 KD adipocytes.
Individual lipid species in fractions 3 and 4 (DRM) and in fractions 7-12 (soluble) domains were summed. All species in the DRM (A) or soluble domains (B) were then summed for each lipid and expressed as a percentage of the total. The percentage of CER, MHC, DHC, THC, SM, PC, PI, PS, PE, BMP, PG and cholesterol (Chol) is shown. The ratios of 18:1/24:0 to 18:1/24:1 for CER, MHC, DHC and SM (SM 1) and 18:1/16:0 to 18:1/16:1 for SM (SM2) are shown in the DRM (C) and soluble membrane domains (D). Results for control (open bars) and SCD1 KD (filled bars) adipocytes are expressed as the mean and standard deviation (n = 3). *Significant at p<0.05, **significant at p<0.01 (Student’s t-test).

