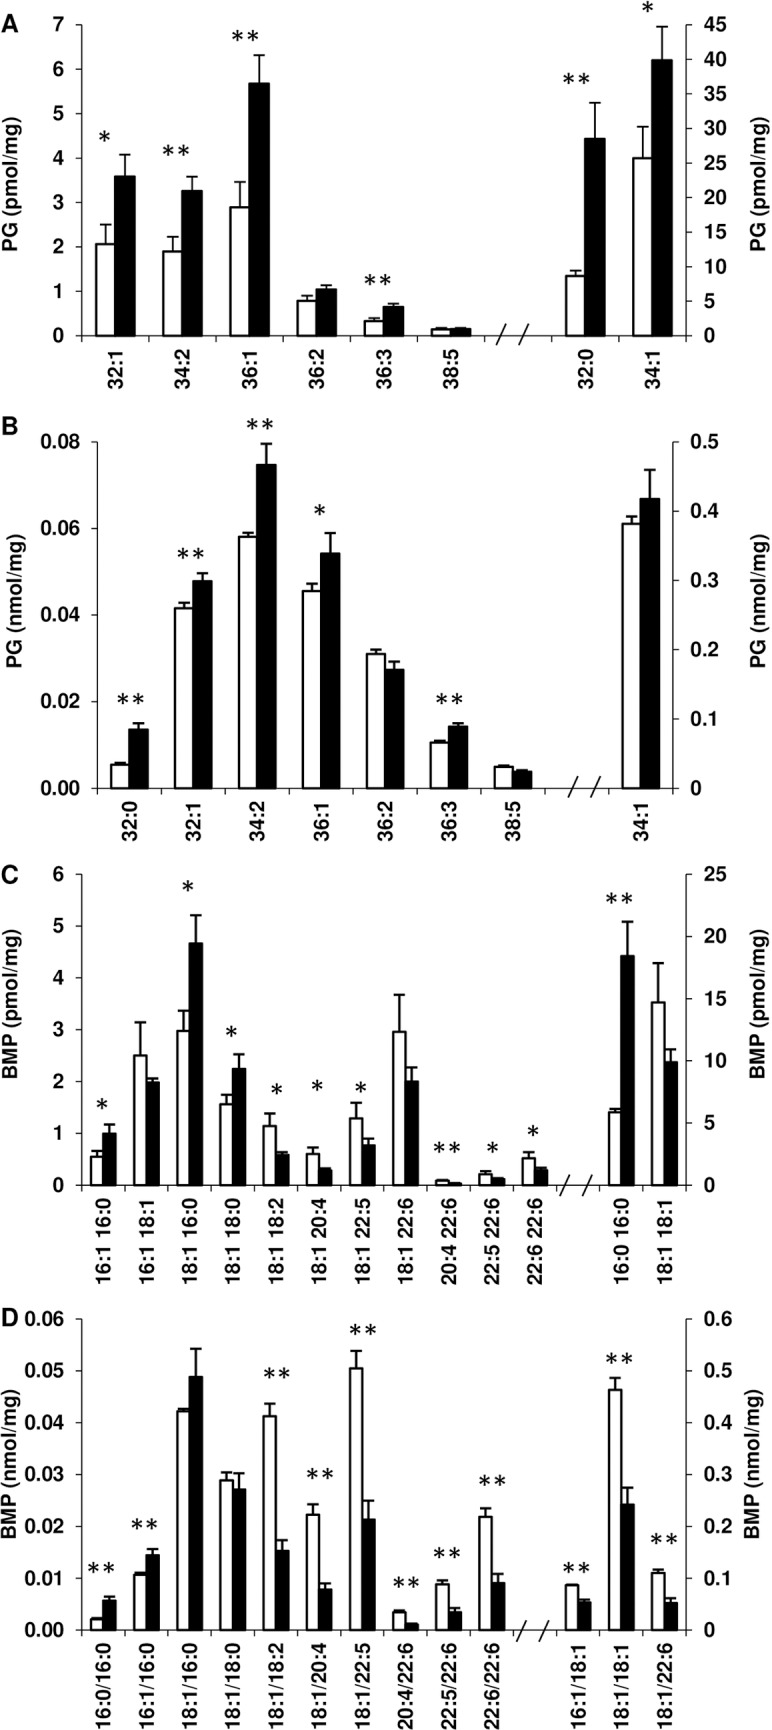
Fig 6. PG and BMP in the membrane microdomains of control and SCD1 KD adipocytes.

The concentration of individual species of PG (A, B) and BMP (C, D) in the DRM (A, C) and soluble membrane domains (B, D) for control (open bars) and SCD1 KD (filled bars) adipocytes are shown. Results are expressed as the mean and standard deviation (n = 3) in nmol or pmol per mg of protein loaded into the sucrose gradient prior to fractionation. *Significant at p<0.05, **significant at p<0.01 (Student’s t-test).
