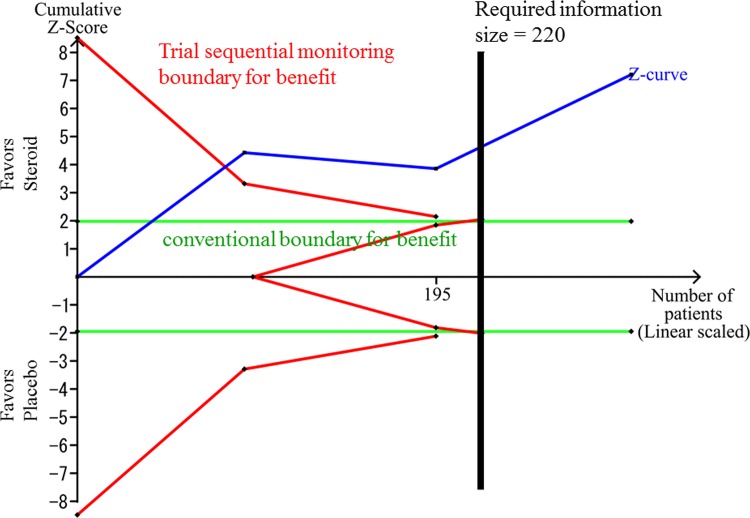
Fig 4. The sensitivity analysis of the Trial Sequential Analysis for the effect of glucocorticosteroids compared with placebo.
The risk of type 1 errors was set at 0.05 with a power of 0.9 when the Trial Sequential Analysis was performed. The variance was calculated from the data obtained from the included trials. A clinically meaningful anticipated mean difference of the QoR-40 score was set at 15 points. We applied the anticipated heterogeneity at 50%.

