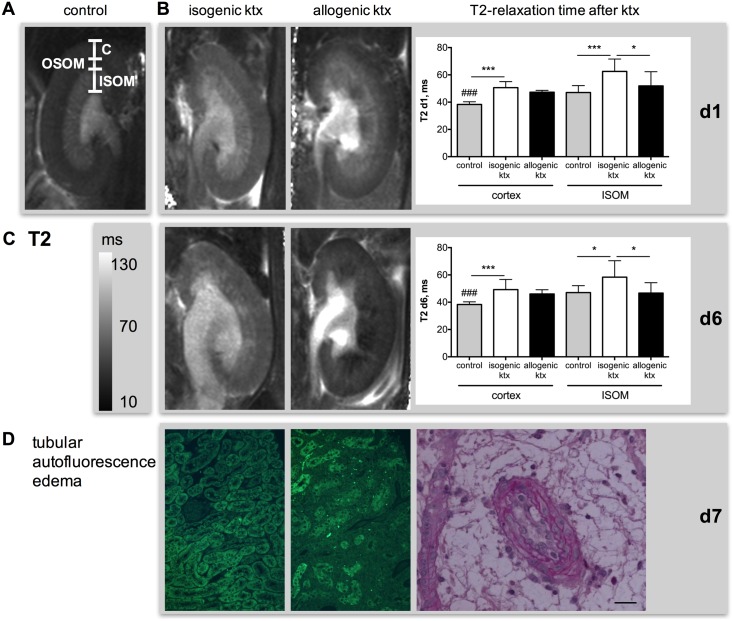
Fig 4. Inflammation and tissue edema in isogenic and allogenic kidney grafts measured by T2-mapping and histology.
T2 maps of a control kidney (A, first column) and isogenic (second column) and allogenic kidney grafts (third column) at day 1 (B) and day 6 (C) are shown. Differentiation of renal compartments such as cortex (C), outer (OSOM) and inner stripe of the outer medulla (ISOM) is visualized in panel A. Note the loss of T2-difference between cortex and ISOM in allogenic grafts at d6 after ktx. This corresponds with the loss of tubular autofluorescence (green), which was associated with rejection and loss of tubular function in allogenic ktx (D). PAS stain shows severe endothelialitis and concomitant surrounding edema in allogenic graft (D). Bar represents 50 μm. *p<0.05, **p<0.01, ***p<0.001, ### p<0.001 compared to allogenic kidney grafts.

