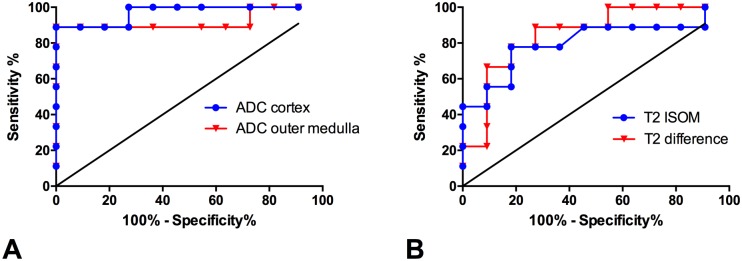
Fig 5. Diagnostic accuracy of functional MRI parameters to discriminate allografts with acute rejection from isografts without rejection.
ROC curve analysis shows diagnostic accuracies of ADC values (A) and T2 relaxation times (B) to discriminate allografts with acute rejection from isografts without rejection. Area under the curve, Youden selected thresholds as well as sensitivities and specificities are given in Table 2.

