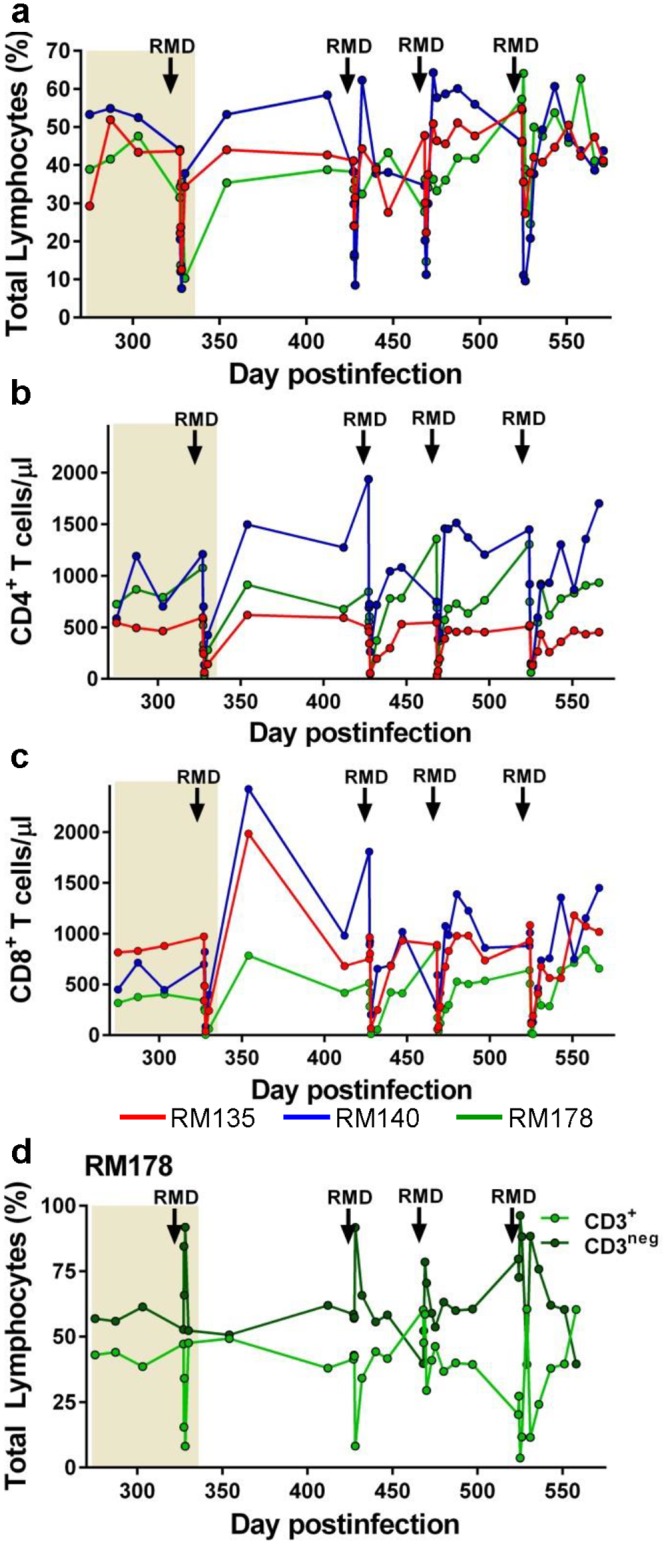
Fig 6. Effect of RMD administration on the peripheral blood major T cell subsets.

(a) The levels of the total lymphocyte population (as measured by the Trucount assay) dramatically, but transiently, decrease after each round of RMD administration, resulting in similarly dramatic decreases of both CD4+ T cell (b) and CD8+ T cell (c) counts. (d) Comparative analysis of the CD3+ and CD3neg populations showed that the reduction in the CD3+ T cell counts was mirrored by a dramatic surge in the population of CD3neg lymphocytes, suggesting the significant reduction in the lymphocyte counts were due to a downregulation of surface markers rather than a real depletion of cells. ART administration is highlighted as a light orange box in the graphs. Time of the RMD administration is illustrated with black arrows.
