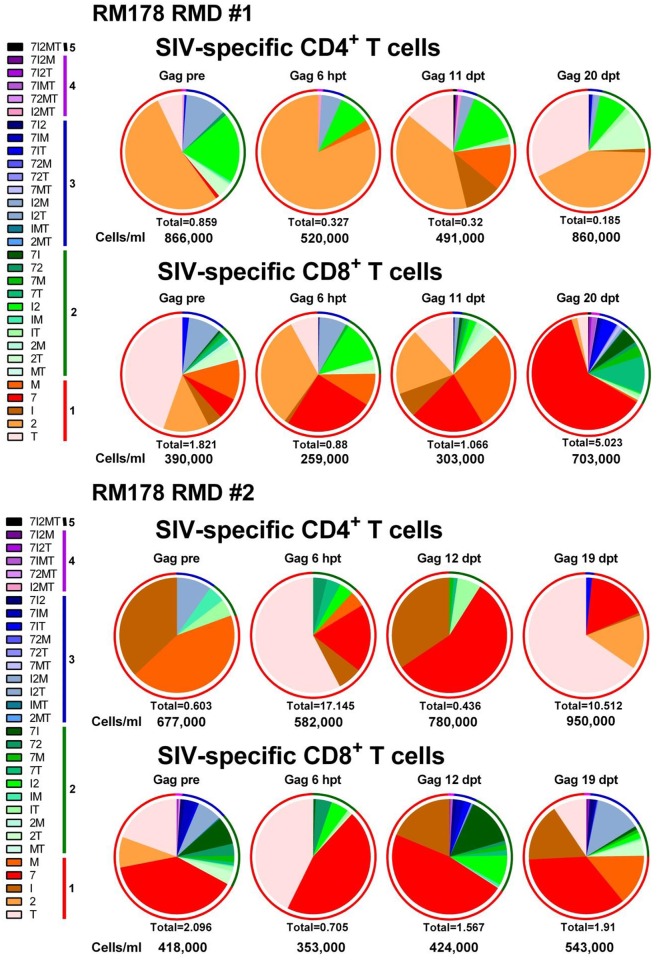
Fig 8. RMD administration does not significantly impact Gag SIV-specific T cell responses or functionality in SIVsmmFTq post-treatment controller RM178.
Serial monitoring of SIV-specific T cell polyfunctionality after two rounds of RMD administration was achieved by stimulating PBMCs with Gag SIVmac239 peptide pools followed by intracellular cytokine staining. Cytokines tested include: TNF-α (T); IL-2 (2); IFN-γ (I); CD107α (7); and MIP-1β (M). Data are representative of all RMs. Absolute numbers of CD4+/CD8+ T cells/ml for each timepoint are presented beneath their respective pie graph. The pie charts depict functionality based on the combination of cytokines expressed, as illustrated in Fig legends. The color scheme represents the number of cytokines that were produced by the SIV-specific T cells (listed as numbers in the Fig legends) and the proportion of each is illustrated as a color-coded ring surrounding each pie chart to facilitate assessment of polyfunctionality.

