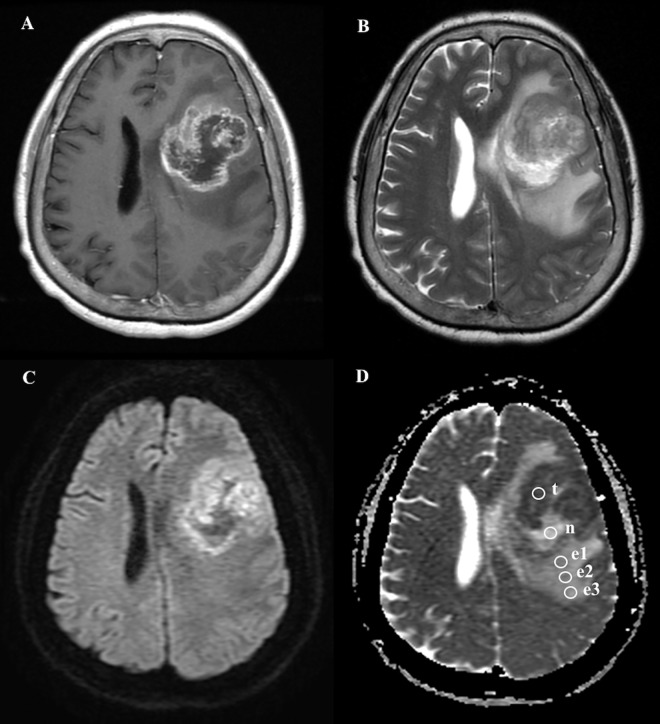
Fig 2. A 64-year-old female with pathologically-proven glioblastoma multiforme after biopsy.
(A) Axial contrast-enhanced T1WI showed a tumor mass with rim enhancement and central hypointense non-enhancing necrosis in the left frontal lobe. (B) Axial T2WI showed extensive peritumoral edema associating with the mass lesion. (C) DWI showed a ring-shaped hyperintense tumor mass, central hypointense tumor necrosis, and isointense peritumoral edema. (D) ADC map showed ROIs (circles) in the tumor necrosis (n), the most strongly-enhanced tumor area (t), and the gradient of peritumoral edema from the most proximally-located area (e1) of the peritumoral edema to the most peripheral location (e3). Measured ADC (b = 1000 sec/mm2) in the tumor necrosis (ADCn) is 1.85 x 10⁻³ mm2/s; the most strongly-enhanced tumor area (ADCt), 0.87 x 10⁻³ mm2/s; proximal peritumoral edema (ADCe1), 1.3 x 10⁻³ mm2/s; middle peritumoral edema (ADCe2), 1.36 x 10⁻³ mm2/s; distal peritumoral edema (ADCe3), 1.43 x 10⁻³ mm2/s.

