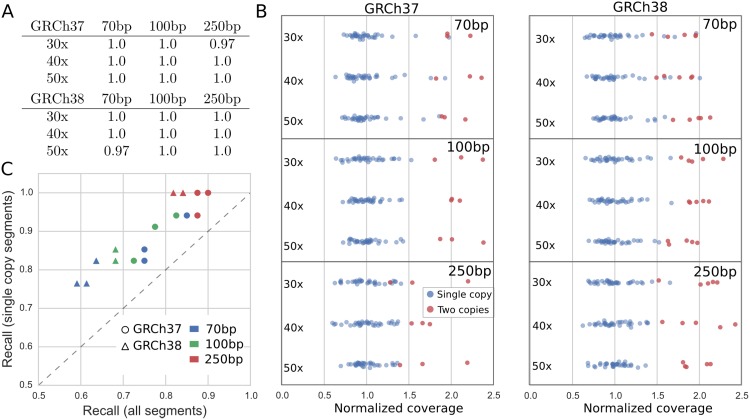
Fig 3. Performance of pipeline on simulated reads from GRCh37 and GRCh38 for varying coverage depths and read lengths.
(A) Recall fractions of the pipeline for the two human reference genomes (precision fractions are all 1 and not shown). Recall is calculated as the fraction of gene clusters in the reference genome that are correctly called by the pipeline. (B) Read coverage depth of each assembled gene cluster (the point estimate for copy number) colored by actual copy number (detailed in S2 Table) in the reference genome. Raw read coverage depth has been normalized by the average coverage of single-copy segments. Jitter has been applied to the vertical coordinates to better show their distribution. (C) The recall of alleles for all gene clusters versus the recall for gene clusters known to be present in the reference in single copy. Each point is one reference genome, coverage depth, read length combination. Note that two red triangles overlap at the point (0.84, 1.0). Different coverage depths are not indicated because there is no pattern between coverage depth and allele reconstruction accuracy.

