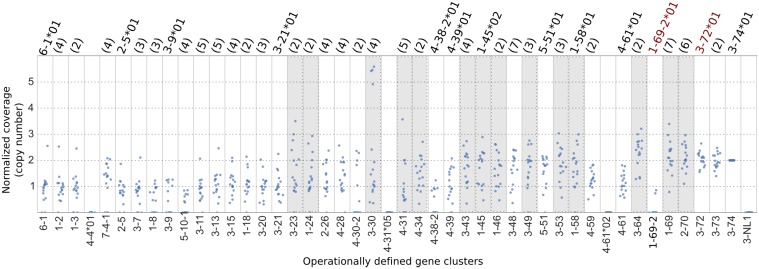
Fig 4. Dotplots of estimated copy number for each gene cluster for Platinum Genomes data.
The Y axis is the normalized coverage, i.e. the coverage depth divided by half of the coverage depth of segment 3-74 (assumed to have two copies). On the X axis, gene clusters are ordered, where possible, according to their location in the reference genome, from 6-1 (centromeric end) to 3-74 (telomeric end). The number in parentheses above each gene cluster is the number of unique allele sequences found in the Platinum Genomes family. If only one allele was found, its name is given (in the case where a segment has only one known allele in the IMGT database, the allele name is in red). Shaded columns indicate gene clusters that likely have more than one copy per chromosome. The outliers for gene clusters 6-1, 1-2, and 1-3 all correspond to a single individual, NA12891, who had relatively uniform coverage across the locus (S5 Fig). Horizontal jitter has been applied to all points to better illustrate the distribution.

