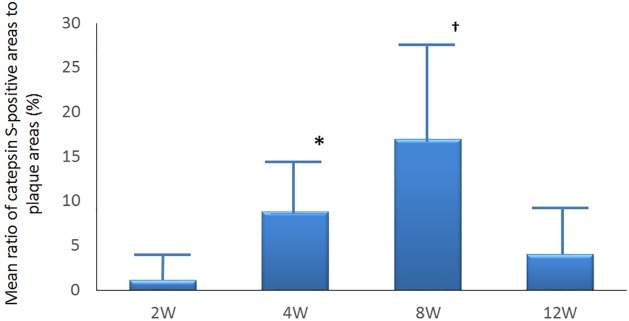
Fig 7. Time dependent changes in ratio of area positively stained for cathepsin S.
Macrophages in lesions were immunohistochemically stained with cathepsin S (n = 12). Mean ratios of macrophages to plaque areas significantly and time-dependently changed at weeks 4* and 8† compared with that at week 2 (8.79% ± 5.98% and 17.00% ± 10.38% vs. 1.14% ± 1.88%; P < 0.0001) whereas at week 12 the ratio decreased towards the value at week 2 (4.00% ± 4.56% vs; baseline P = 0.66).

