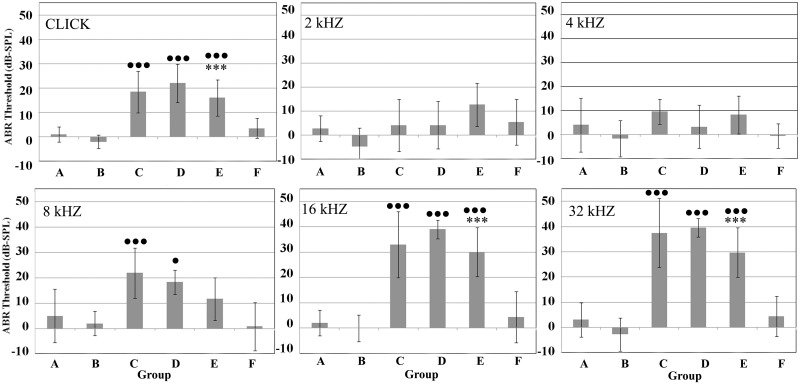
Fig 2. ABR threshold shifts for each treatment group (A-F) at different frequencies.
ABR thresholds are expressed in dB ± standard deviation. ANOVA p-value significance in all groups of treated animals versus untreated controls (A): ● <0.05; ●● <0.01; ●●● <0.001; ANOVA p-value significance between groups untreated and treated with Acu-Qter (A and B, C and D, E and F): *** <0.001.

