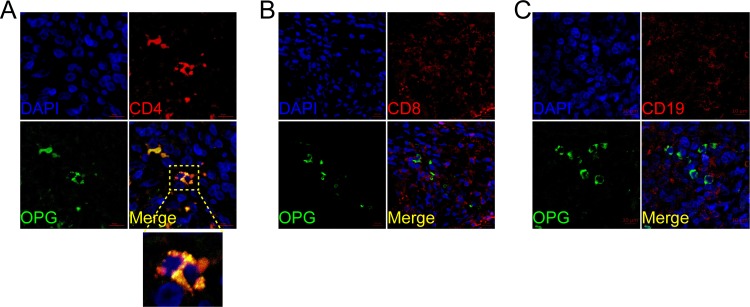
Fig 7. Cellular localization of hepatic osteoprotegerin (OPG) in PBC.
OPG (A, B, C; green) expression in liver was analyzed by confocal scanning microscopy to identify cell types expressing the molecule. Anti-CD4 (CD4+ T lymphocyte), anti-CD8 (CD8+ T lymphocyte), anti-CD19 (B lymphocyte) are shown in red. Co-localization staining between anti-RANK and anti-CD4 is represented by yellow (green+ red). Cell nuclei are stained in blue. Scale bar indicate 10μm.

