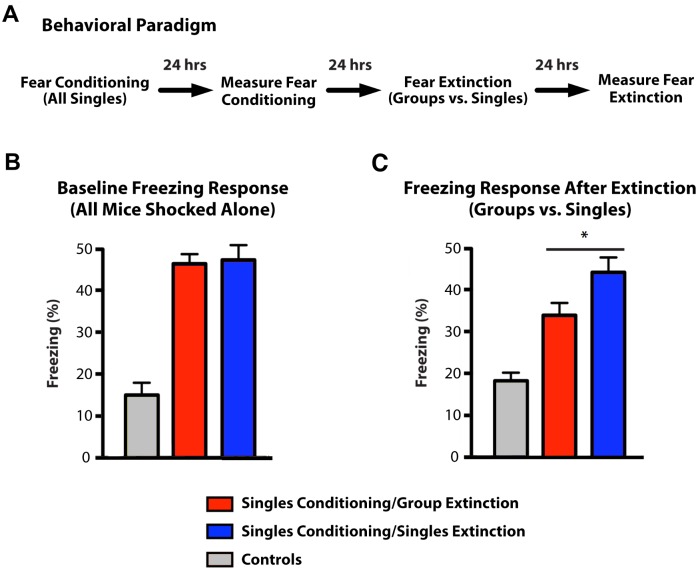
Fig 4. Fear extinction in groups of five versus alone.
(A) Diagram of behavioral paradigm. (B) After fear conditioning, values represent percentage of freezing time for mice from both cohorts first exposed as singles, compared to non-foot shocked controls. (C) After fear extinction, values represent percentage of freezing time for mice when re-exposed to the conditioning environment as a group (Singles Conditioning/Singles Extinction, red column) or alone (Singles Conditioning/Group Extinction, blue column), compared to non-foot shocked controls. All values represent mean ± s.e.m. * P = 0.014, two-tailed t test (N = 15).

