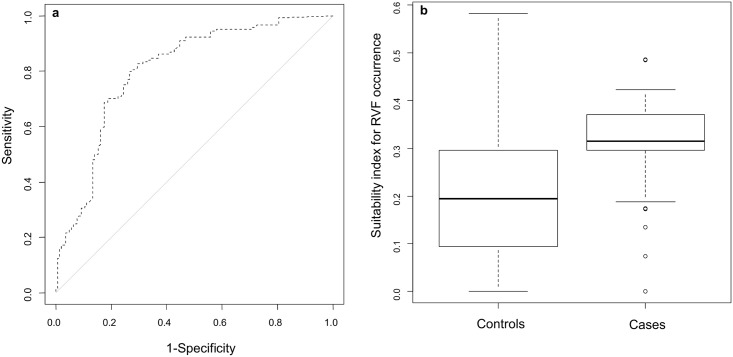
Fig 4. Assessment of the suitability index for RVF occurrence in livestock in Kenya and Tanzania.
a) ROC curve. b) Box-plot showing RVF occurrence suitability index values for cases (RVF outbreak locations) and controls (random ‘pseudoabsence’ locations). Box-plots show median values (solid horizontal line), 50th percentile values (box-plot outline), 90th percentile values (whiskers), and outlier values (open circles).

