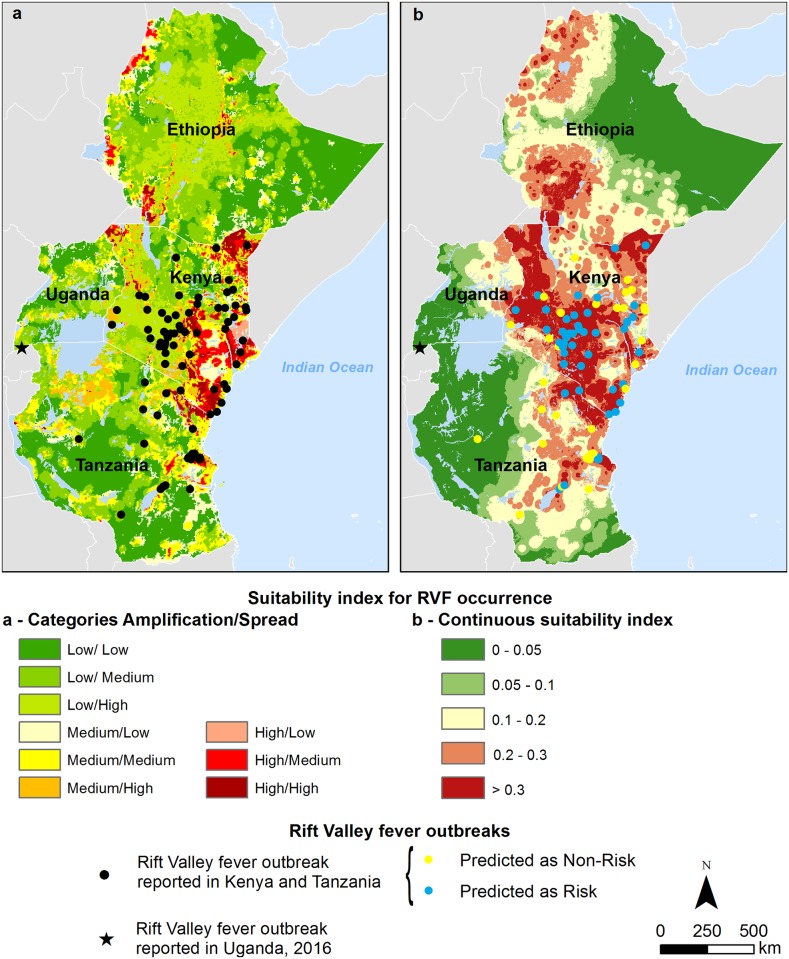
Fig 5. Suitability maps for RVF occurrence and the locations of RVF outbreaks in livestock: a) Combination of amplification and spread suitability categories; (b) continuous suitability index.
Blue dots indicate the outbreak locations that were identified in the RVF at-risk areas. Yellow dots indicate outbreak locations not considered to be at-risk.

