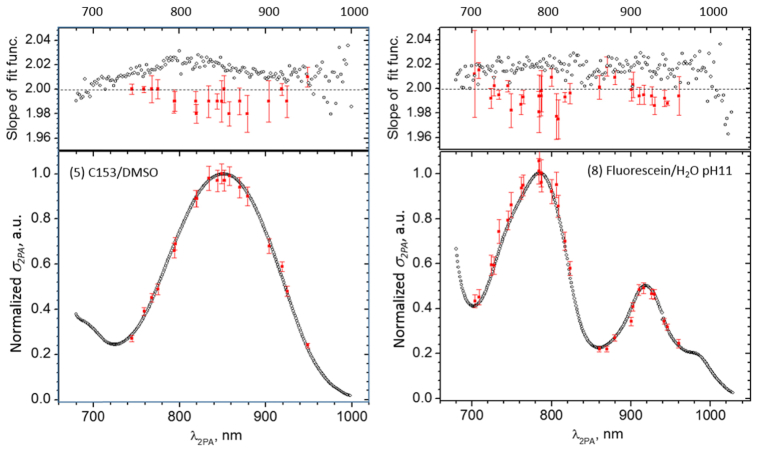
Fig. 4.
. Comparison between independent 2PEF measurement techniques in two reference samples: C153 in DMSO (left) and Fluorescein in aqueous, pH11 (right). Upper panel: Experimentally determined power law coefficient as a function of laser wavelength measured using the scanning laser setup (empty symbols) and manually-tuned laser setup (filled symbols). Lower panel: 2PA shape functions measured by the scanning laser setup (empty symbols) and manually tuned laser setup (filled symbols). The maximum value of the shape functions is normalized to unity. The manually-tuned data is averaged over 9 measurements in C153 and 3 measurements in Fluorescein.

