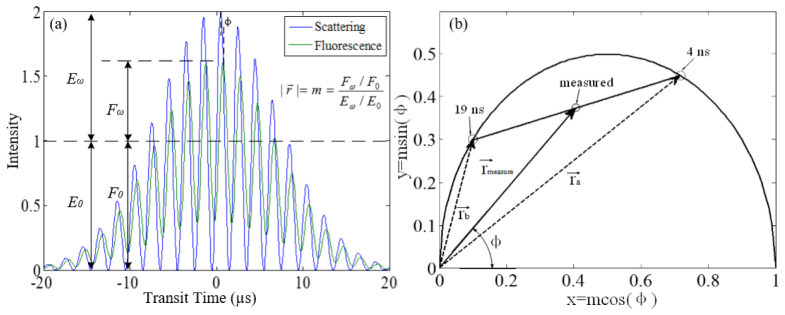
Fig. 3.
The transfer from a raw data of an event (a) to one dot in the phasor plot where the dots located on semicircle indicate single lifetimes (b). The location [1, 0] represents 0 ns, and the location of origin [0, 0] represents an infinite lifetime. Fluorescence lifetimes along the semicircle increase counter-clockwise to the left. In this coordinate system the measured value is the intensity-weighted average of the lifetime components. The magnitude of the vector equals the demodulation of the measured event m, and the angle between x-axis and vector equals the phase shift ϕ. The line joining the lifetime components notes the location of the measured event. In this example, the measured event is located in the middle of the line joining single lifetimes of 4 ns and 19 ns. The plot reveals the event consists of an equivalent fraction of 4 ns and 19 ns components. The solid lines represent the phase shift and demodulation vector for the dual-lifetime simulation, and the dashed lines represent single lifetime component vectors thereof.

