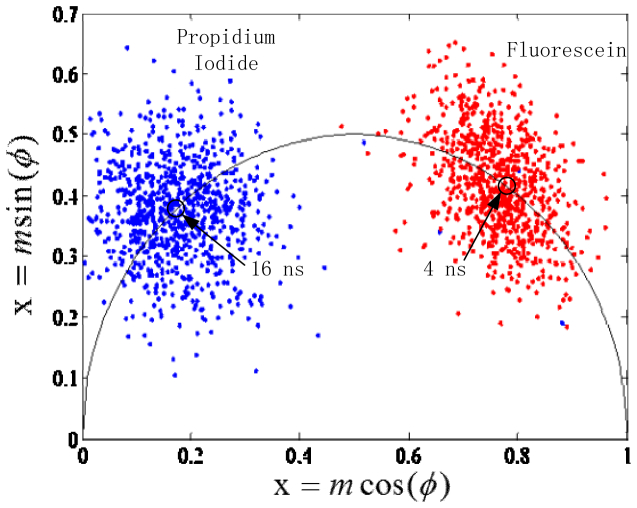
Fig. 4.
Phasor plot representations from fluorescence data on single fluorophore-labeled microspheres. The red population is data from fluorescein microspheres and the blue is of PI microspheres, with the calculated value of their respective fluorescent lifetimes shown by the open marker on the semicircle.

