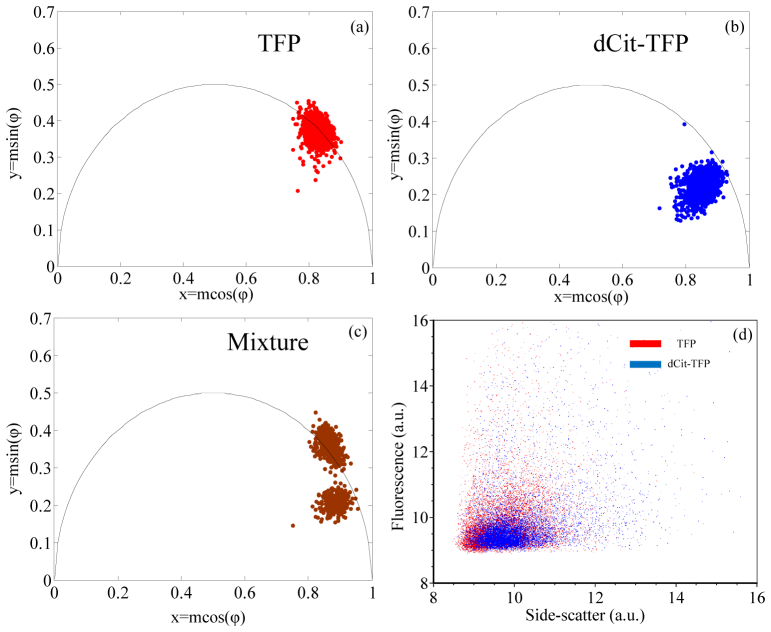
Fig. 6.
Phasor plot representations of yeast cells expressing different fluorescent protein constructs. (a), (b), and (c) are the phasor plots of cells producing TFP, TFP linked to dark citrine fluorescence protein, and an equal mixture of cells that express either TFP or TFP-dCit, respectively. (d) is a dot plot of two parameters (side scatter and fluorescence intensity) where the blue dots represent TFP-dCit expressing cells and the red dots represent the TFP expressing cells.

