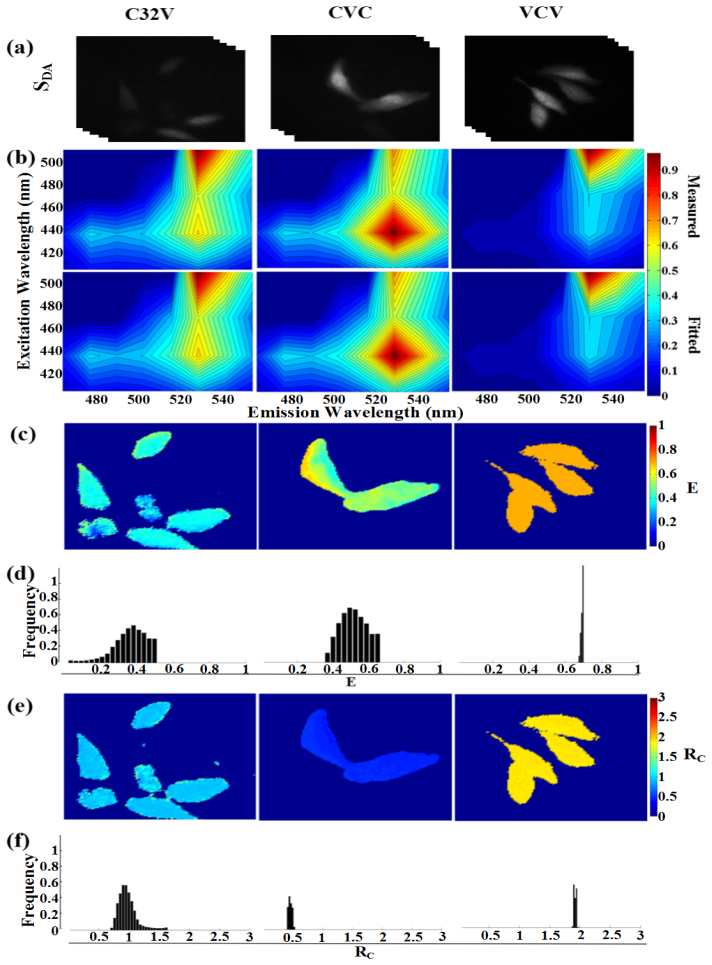
Fig. 7.
Microscopic EES-FRET imaging of living cells expressing constructs with different donor-acceptor stoichiometry. (a) Representative spectral image-stacks (SDA) for living HepG2 cells expressing C32V, CVC and VCV, respectively. (b) The measured and fitted excitation-emission spectra of the brightest pixel in (a). (c and d) Pixel-to-pixel E images (c) and histograms (d) corresponding to (a). (e and f) Pixel-to-pixel RC images (e) and histograms (f) corresponding to (a).

