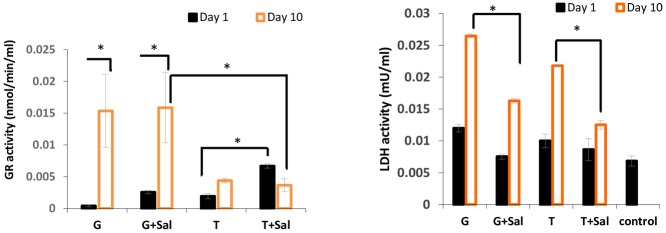
Fig 4. Sheep RBCs enzymatic activities measured after thawing at day 1 and day 10 of cold storage in SAGM media with and without Sal.
The graph on the left shows intracellular glutathione reductase (GR) and the graph on the right showed intracellular LDH activity. The data are expressed as mean ± SD (* = p <0.05).

