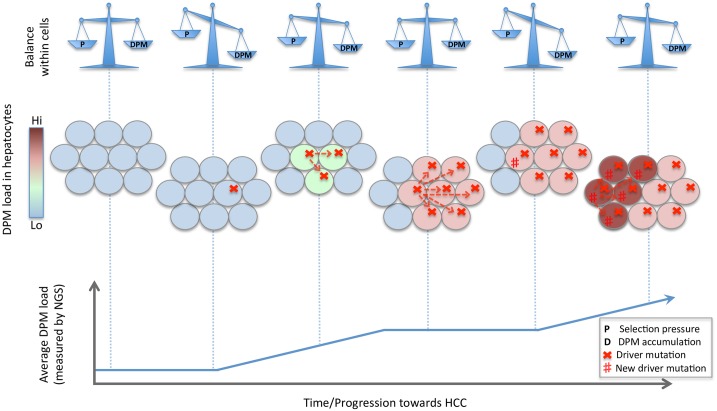
Fig 6. Hypothetical model of HCC progression.
HCC progression is presented here as multiple waves of driver sweeps within hepatocyte subclones. The equilibrium between DPM accumulation and negative selection on the hepatocyte subclones are shown in the top row. A schematic model of the liver (with each circle representing a hepatocyte and the colour gradient representing the DPM load within each hepatocyte) is shown in the centre row. The average DPM load for the tissue is depicted in the bottom row.

