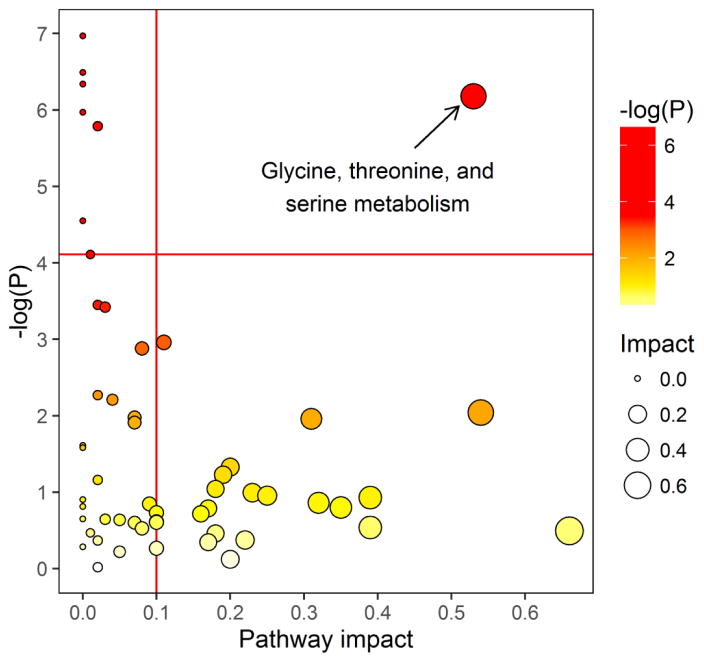
Figure 2.
Overview of pathway enrichment analysis. All dots represent matched pathways from topology pathway analysis. Pathways are colored according to their significance values from pathway enrichment analysis, with gradations from yellow, having the least significance, to red having the highest significance (exact P values are given in Tables 3 and S2). Pathways above the horizontal red line correspond to q<0.1. Pathway impact is indicated on the x-axis. Pathways to the right of the vertical red line on the x-axis have an impact score >0.1. Glycine, threonine and serine metabolism was the only significant pathway with q<0.1 and a pathway impact value >0.1. Other pathways that were significant but had a negligible pathway impact (e.g., <1: thiamin, porphyrin, cyanoamino acid, glutathione, methane and sphingolipid metabolism; all values are given in Table 3) all included glycine.

