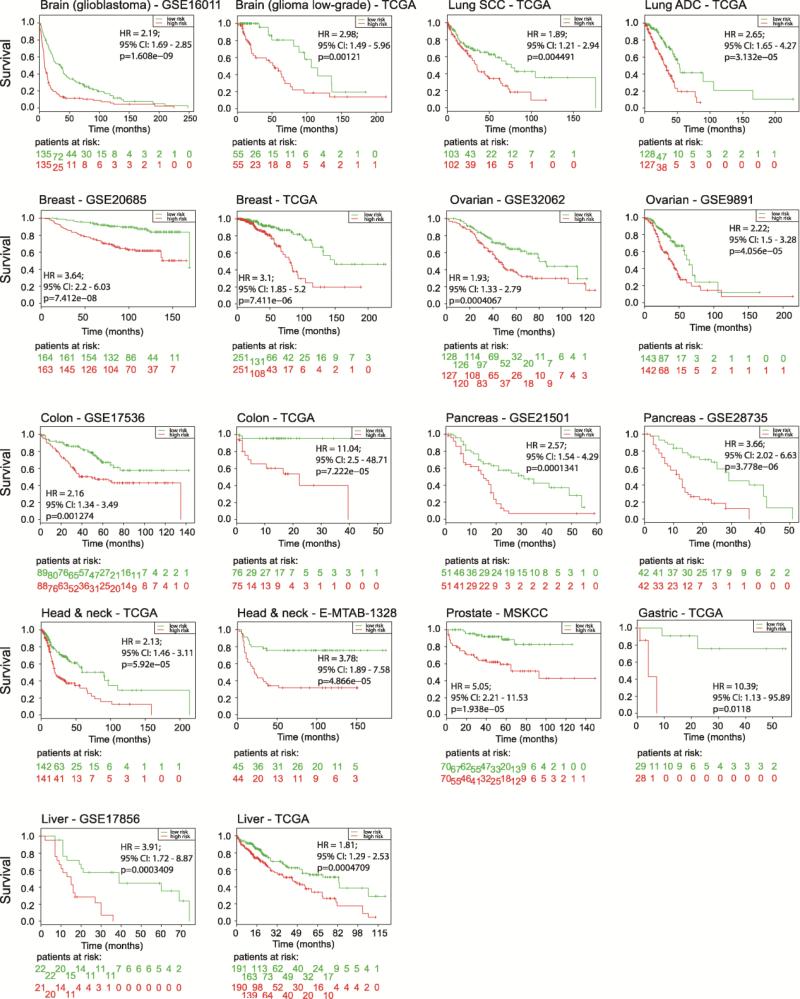
Figure 3.
The 18-gene signature is associated with human cancer disease-free survival. For each tumor type, survival risk curves are shown; low and high risks are drawn in green and red, respectively. An estimate of the hazard ratio (HR) between groups is shown using the risk group prediction as the covariate in a Cox model (95% confidence interval (CI) is shown). The p-value represents the equality of survival curves based on a log-rank test. Bottom rows represent the number of patients not presenting the event at the specified time.

