FIGURE 3:
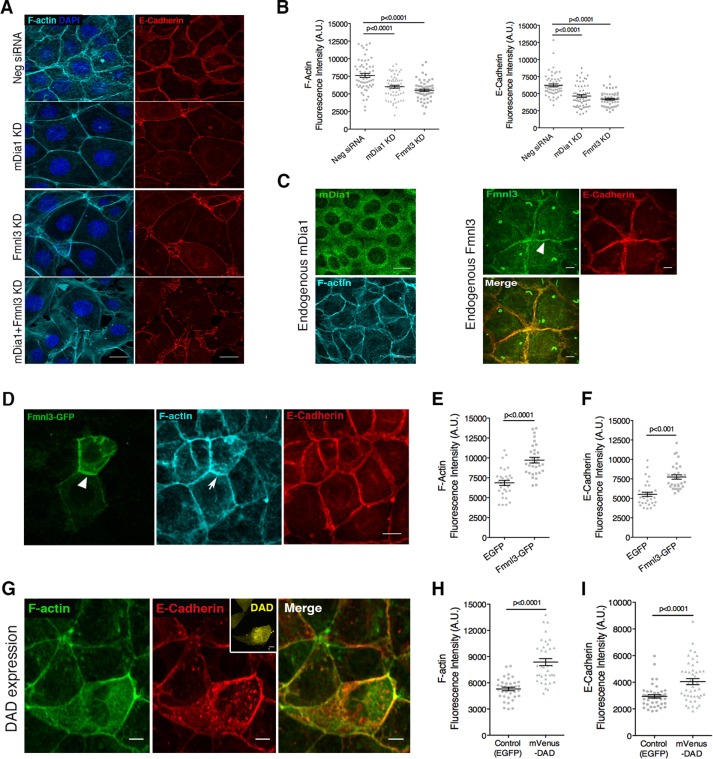
Formins mDia1 and Fmnl3 regulate AJ organization in epithelial cells. (A) Phenotypes obtained upon siRNA-mediated KD of mDia1, Fmnl3, or both in Eph4 monolayers, labeled to visualize F-actin and E-cadherin; note the reduction in lateral junctions and increased cell area associated with mDia1 or Fmnl3 KD. (B) Quantification of F-actin and E-cadherin fluorescence intensities at the AJ for A; 65 junctions in control and 62 junctions in mDia1 KD and Fmnl3 KD from three independent experiments, with mean ± SEM (C) Endogenous mDia1 exhibits diffuse localization in Eph4 cells, whereas endogenous Fmnl3 localizes at the AJ, colocalizing with E-cadherin. Arrowhead indicates Fmnl3 labeling at cell–cell junctions. (D) GFP-tagged Fmnl3 localizes to AJ (white arrowhead), resulting in elevated levels of F-actin (white arrow) and E-cadherin. (E, F) Quantification of F-actin and E-cadherin fluorescence intensities, respectively, at the AJ for D; 30 transfected cells per condition from three experiments, with mean ± SEM (G) Representative image of Eph4 cells transfected with mVenus-DAD labeled to visualize F-actin and E-cadherin. Note the abundance of F-actin and E-cadherin in the DAD-transfected cell (mVenus fluorescence shown in inset) in comparison to nontransfected neighbors. (H, I) Quantification of F-actin and E-cadherin fluorescence intensities, respectively, at cell–cell junctions for G; ≥30 transfected cells per condition from thee experiments, with mean ± SEM. Statistical significance assessed using one-way ANOVA in B; Student’s t test in E, F, H, and I. Scale bars, 20 μm (A, D), 10 μm (C, G).

