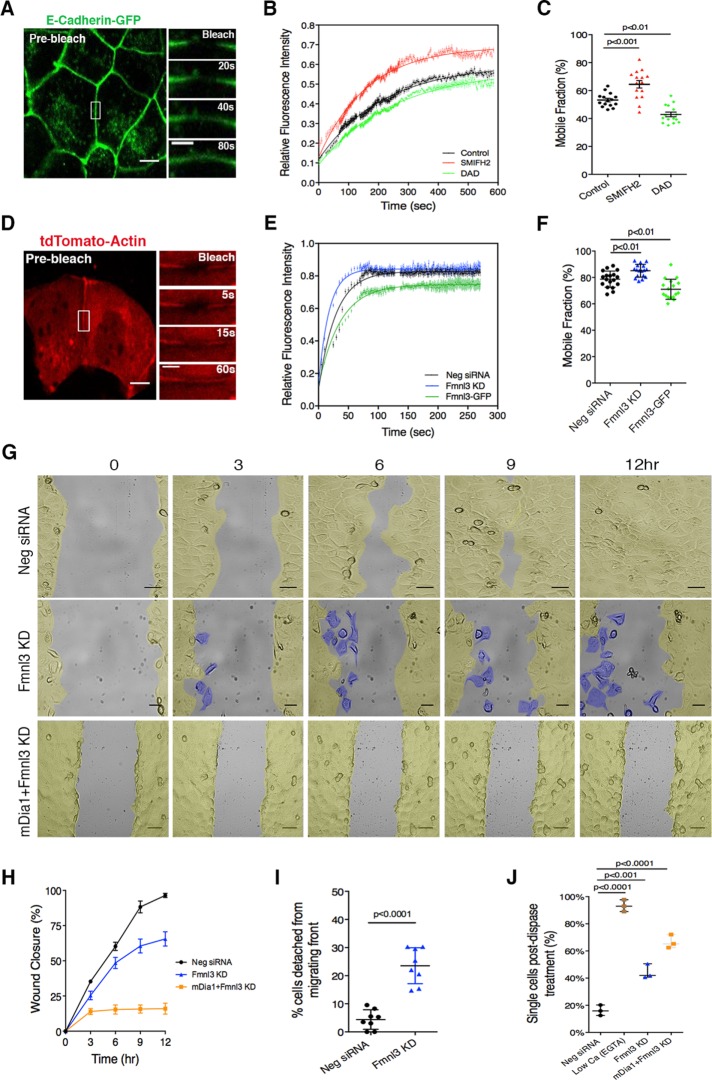
FIGURE 4:
Formin activity affects molecular dynamics at the AJ and is essential for monolayer cohesion during collective cell migration. (A) Eph4 monolayer expressing E-cadherin–GFP; junctional E-cadherin–GFP was photobleached (white rectangle) in FRAP experiments. Magnifications illustrate recovery of E-cadherin fluorescence. (B) FRAP recovery curves comparing the effects of SMIFH2 treatment and DAD expression on E-cadherin dynamics at the AJ. Data are shown as an average for 15 junctions tested for each condition. (C) Mobile fractions corresponding to conditions tested in B; 15 junctions for every condition tested, with mean ± SEM. (D) Eph4 cells transfected with tdTomato-actin and plated on fibronectin islands; junctional actin was photobleached (white rectangle) in FRAP experiments. Magnifications illustrate recovery of actin fluorescence. (E) FRAP recovery curves comparing the effects of Fmnl3 KD and Fmnl3 overexpression (Fmnl3-GFP) on actin dynamics at the AJ. Data are shown as an average for 18 junctions tested for Neg siRNA and 17 junctions in Fmnl3 KD and Fmnl3-GFP conditions from three independent experiments. (F) Mobile fractions corresponding to conditions tested in E; 18 (Neg siRNA) or 17 (Fmnl3 KD and Fmnl3-GFP) junctions tested, with mean ± SD. (G) Montage from a movie of an in vitro scratch assay in control (Neg siRNA), Fmnl3 KD, or double KD (mDia1 and Fmnl3) conditions. Images are pseudocolored in yellow to indicate cohesive regions of the cell sheet and in blue (middle) to highlight cells that have detached from the migrating front. See Supplemental Movies S3, S4, and S7. (H) Quantification of wound closure. Eight (Neg siRNA and Fmnl3 KD) and nine (mDia1 + Fmnl3 KD) movies imaged in G, with mean ± SEM. (I) Quantification of cells detaching from migrating front (%). Eight movies for each condition, with mean ± SD. (J) Dispase assay to determine adhesion strength for conditions tested in G. EGTA treatment served as a low–adhesion strength control. Individual dots represent a single experiment (n = 3), with mean ± SD. Statistical significance was assessed using one-way ANOVA in C, F, and J; Student’s t test in I. Scale bars, 10 μm (A, D), 5 μm (magnification in A, D), 50 μm (G).

