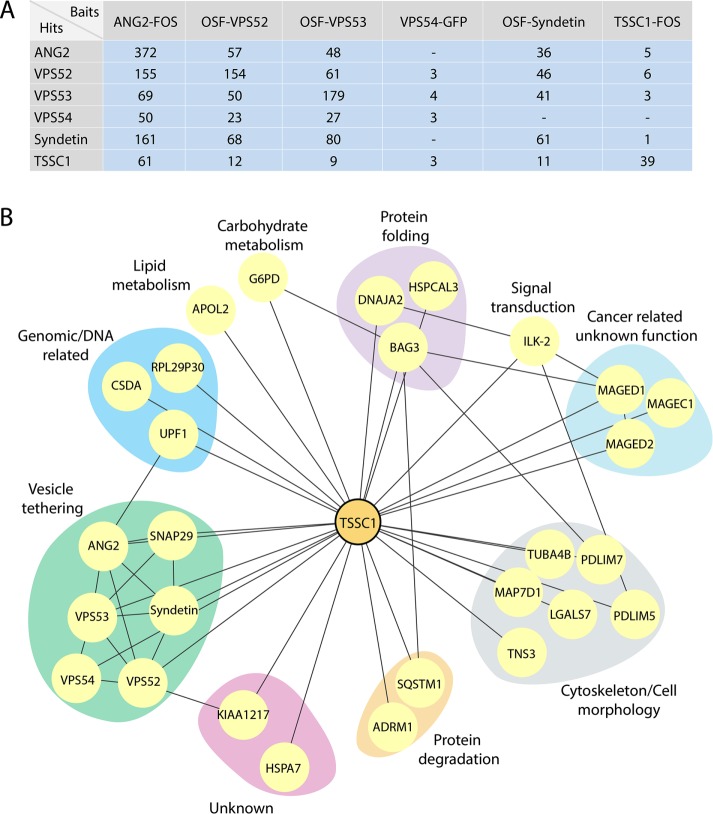
FIGURE 2:
Affinity purification and mass spectrometric analysis of GARP and EARP interactors. (A) Table showing the proteins (Hits) coisolated by affinity purification from H4 cells expressing the FOS-, OSF-, or GFP-tagged proteins indicated on top (Baits). Total numbers of peptides found in mass spectrometry. ANG2 and Syndetin are also designated VPS51 and VPS50, respectively, by the HUGO Gene Nomenclature Committee. (B) Network analysis showing the interactions between the hits from our screens filtered by the CRAPome (www.crapome.org) and interactions mapped using the BioGRID database (thebiogrid.org). Proteins were grouped according to their Gene Ontology classification.

