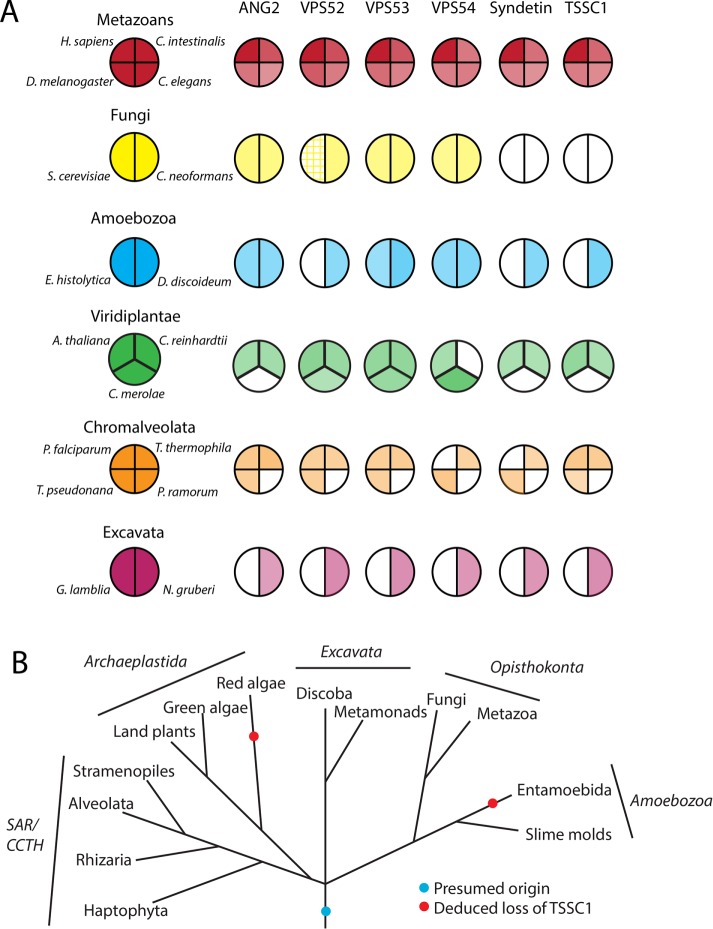
FIGURE 3:
Phylogenetic analysis of GARP and EARP subunits and TSSC1. (A) Coulson plot (Field et al., 2013) showing the existence of ANG2, VPS52, VPS53, VPS54, Syndetin, and TSSC1 orthologues in a variety of eukaryotes chosen for their diversity as in Hirst et al. (2011). Color intensity represents the degree of identity based on a BLASTP alignment with the human homologue. Hatched shading indicates a known homologue that shares little primary sequence homology. (B) Deduced evolutionary history of TSSC1 (based on Walker et al., 2011).

