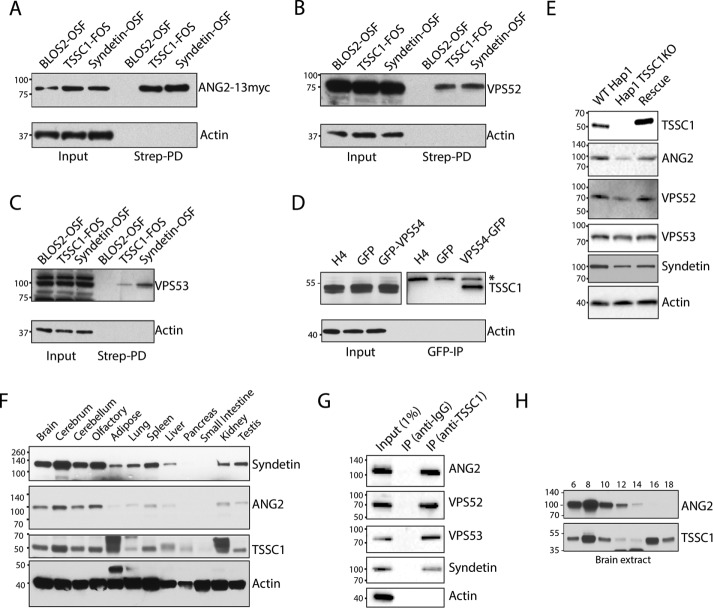
FIGURE 4:
Biochemical analysis of TSSC1. (A–C) Extracts from H4 cells stably expressing BLOS2-OSF (negative control), Syndetin-OSF (positive control), or TSSC1-FOS were analyzed by pull down with StrepTactin beads, followed by SDS–PAGE and immunoblotting for coexpressed ANG2-13myc and endogenous VPS52, VPS53, and actin (negative control). (D) Extracts from untransfected and stably expressing GFP or VPS54-GFP cells were analyzed by pull down with a nanobody to GFP conjugated to magnetic beads, followed by SDS–PAGE and immunoblotting for endogenous TSSC1 and actin (negative control). *Nonspecific band. (E) WT and TSSC1-KO HAP1 cells, and TSSC1-KO HAP1 cells rescued by stable expression of TSSC1-FOS, were analyzed by SDS–PAGE and immunoblotting with antibodies to TSSC1, ANG2, VPS52, VPS53, Syndetin, or actin (negative control). (F) SDS–PAGE and immunoblot analysis of the expression of Syndetin, ANG2, TSSC1, and actin in multiple rat tissues. (G) A rat brain extract was subjected to immunoprecipitation with antibodies to immunoglobulin G (negative control) or TSSC1 followed by SDS–PAGE and immunoblot analysis of the precipitates with antibodies to ANG2, VPS52, VPS53, Syndetin, and actin. A 1% fraction of the input extract was run alongside for comparison. (H) Gel filtration of rat brain extract on a Superose 6 column and analysis of the fractions indicated on top by SDS–PAGE and immunoblotting with antibodies to ANG2 and TSSC1. In all the immunoblots, the positions of molecular mass markers (in kilodaltons) are indicated on the left.

