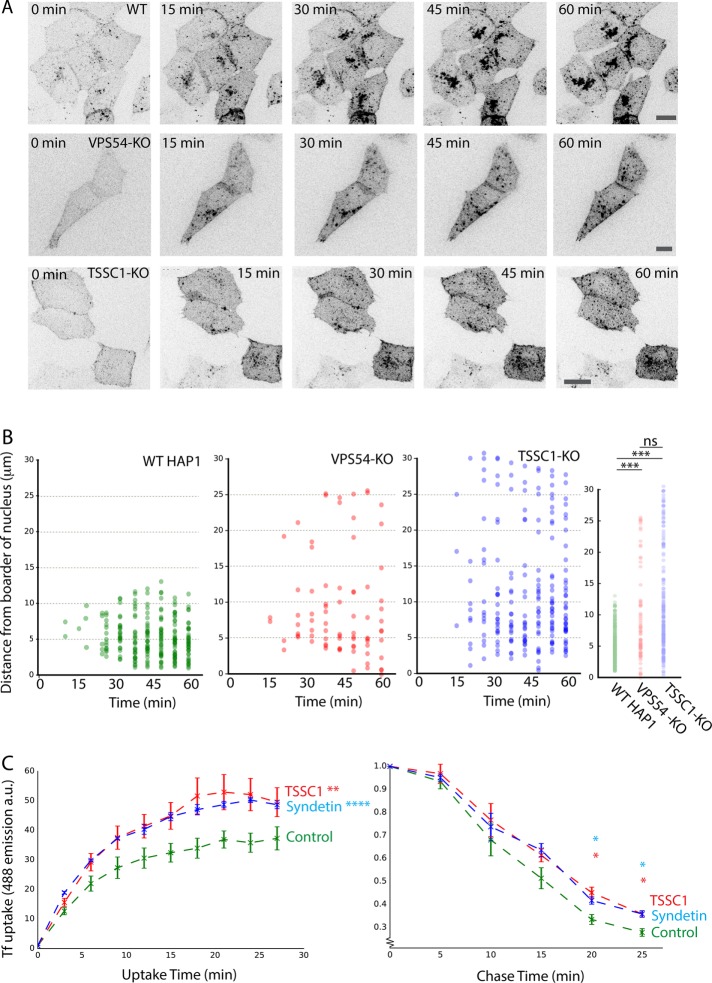
FIGURE 7:
(A) Live-cell imaging of Cy3-STxB uptake in WT, VPS54-KO, and TSSC1-KO HAP1 cells. Cells were incubated for 1 h in the continuous presence of Cy3-STxB and imaged over the course of 1½ h by spinning-disk confocal microscopy. At each time point, a z-stack of the whole cell was taken and averaged into a maximum intensity projection. Scale bar, 10 μm. See Supplemental Videos S1–S3 for complete time course. (B) Distance quantification of data set from A. Each point plotted represents an individual detectable punctate structure, plotted showing its distance from the center of the nucleus. Left, combination of at least 70 data points from multiple cells over time; far right, combination of all data, demonstrating the relative proximity of the STxB punctae to the nucleus in the WT cells. Significance was calculated using Student’s t test. (C) FACS analysis of Alexa 488–Tf uptake into control HeLa cells or HeLa cells treated with siRNAs to TSSC1 or Syndetin. The plot represents the geometric mean of Alexa 488–Tf intensity of the population (∼30,000 cells) as a function of time. Error is the SEM from multiple independent experiments. Left, continuous exposure to Alexa 488–Tf (significance calculated as two-way analysis of variance); right, chase experiment after 30-min uptake (significance calculated using Student’s t test at selected time points). ns: p > 0.05, *p ≤ 0.05, **p ≤ 0.01, ***p ≤ 0.001, ****p ≤ 0.0001.

