FIGURE 8:
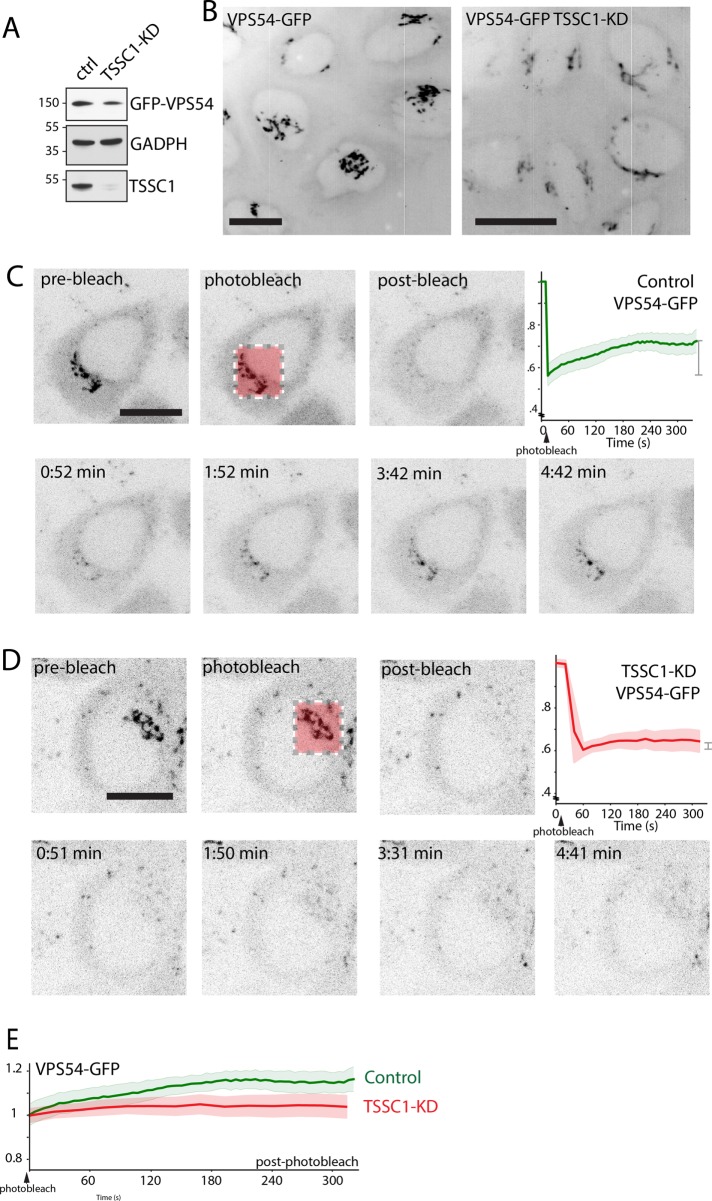
TSSC1 regulates the recruitment of VPS54-GFP to the TGN. (A) SDS–PAGE and immunoblot analysis of VPS54-GFP in control and TSSC1-KD H4 cells. The positions of molecular mass markers (in kilodaltons) are indicated on the left. (B) Live-cell imaging of VPS54-GFP in a series of sequential z-stacks. The z-stacks were combined into a maximum intensity projection, and then the whole time series was combined into a maximum intensity projection, resulting in a four-dimensional projection. Scale bar. 10 μm. (C, D) FRAP analysis of VPS54-GFP at the TGN of control and TSSC1-KD H4 cells. Scale bar, 10 μm. The graphs represent the fluorescence intensity as a function of time for each cell line. (E) Graph comparing the recovery of VPS54-GFP fluorescence in control (green) and TSSC1-KD cells (red) with postbleaching intensity normalized to 1.

