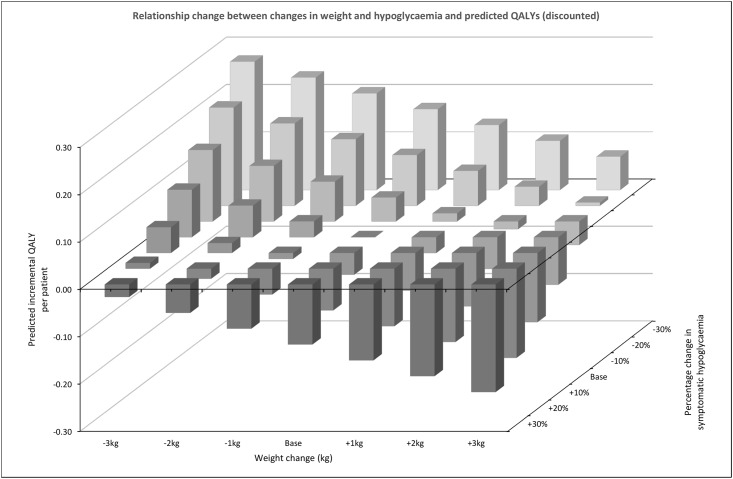
Fig 3. Weight and hypoglycaemia QALY plot.
Assessing the impact of changes in weight and rates of hypoglycaemia events on per-patient lifetime quality-adjusted life year (QALY) difference. The reference point relates to a 1% reduction in HbA1c (%) with no associated changes in weight or hypoglycaemia, which was associated with a predicted QALY gains of 0.99. This figure illustrates the relative impact of weight change ±3 kg and hypoglycaemia changes ±30% on the QALY gained, beyond those already seen with the reference point.

