Figure 2.
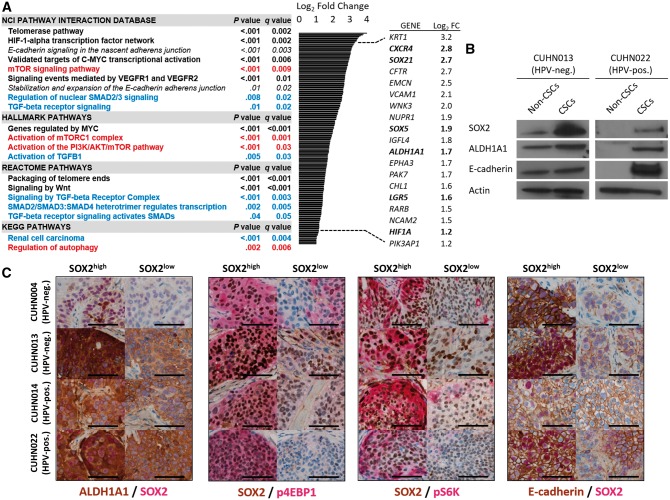
Transcriptome and protein expression profile of head and neck squamous cell carcinoma (HNSCC) cancer stem cells (CSCs). A) Gene set enrichment analysis (GSEA) pathway enrichment in HNSCC CSC populations compared with cells negative for CSC markers and relevant genes statistically significantly upregulated in CSCs across cases (bold = stem cell–related processes; red = phosphoinositide 3-kinase (PI3K)/ mechanistic target of rapamycin (mTOR)–related pathways; blue = transforming growth factor beta–related pathways). Statistical significance was calculated by a two-sided modified Kolmogorov-Smirnov permutation test. B) Immunoblot and reverse transcription polymerase chain reaction analysis of tumor-derived (CUHN013, CUHN022) CSCs and cells negative for CSC markers. C) Co-expression of SOX2 with aldehyde dehydrogenase (ALDH)1A1, markers of PI3K/mTOR pathway activation and E-cadherin in vivo. Scale bars = 100 µm. CSC = cancer stem cell; HNSCC = head and neck squamous cell carcinoma; HPV-neg. = human papilloma virus–negative; HPV-pos. = human papilloma virus–positive; mTOR = mechanistic target of rapamycin; PI3K = phosphoinositide 3-kinase; TGF-β = transforming growth factor beta.

