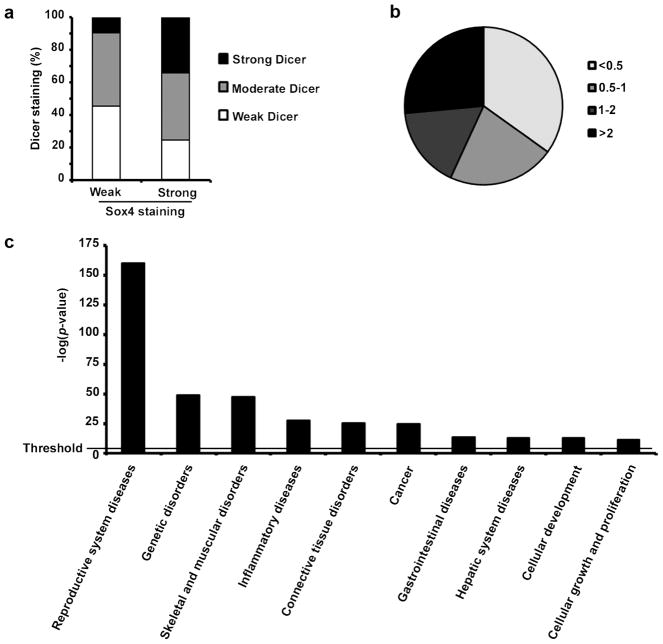
Figure 5.
Regulation of miRNAs expression by Sox4 in melanoma. (a) positive correlation between Sox4 and Dicer expression in 144 melanocytic lesions at different stages. Dicer expression was compared between weak or strong Sox4 expressing cases (P = 0.004, χ2 test). (b) Total RNA from siCTR or siSox4 transfected MMRU cells was prepared with Qiazol extraction followed by Poly-A Tailing reactions and miRNA cDNA synthesis. miRNAs were grouped by pair-wise comparison of our expression data sets (siSox4 vs siCTR) based on their expression fold-change. (c) Functional analysis of the miRNA profiling data was performed using the Ingenuity Pathway Analysis. The horizontal line indicate the p-value = 0.05 threshold.

