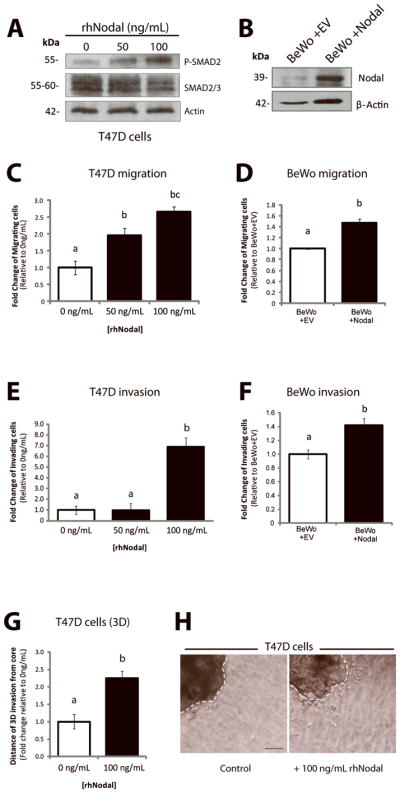
Figure 1. Nodal promotes invasion and migration in breast cancer and choriocarcinoma cell lines.

(A) Western blot validating increased P-SMAD2 in response to treatment with rhNodal in T47D cells. Total SMAD2/3 and β-Actin are used as controls. (B) Western blot validating increased Nodal expression in BeWo cells following transfection with a control versus Nodal-expression construct. The pro-Nodal (~39 kDa) band is presented and β-Actin is used as a control. (C) T47D cells were seeded in Transwell chambers and treated with 0, 50 or 100 ng/mL of rhNodal for 24 hours to assess cellular migration. Cells exhibited a significant dose-dependent up-regulation of cellular migration in response to rhNodal (n=4, p<0.05). (D) BeWo cells overexpressing Nodal (BeWo+Nodal) versus a control vector (BeWo+EV) were seeded in Transwell chambers to assess cellular migration after 24 hours. BeWo+Nodal cells exhibited elevated cellular migration compared to BeWo+EV cells (n=6, p=0.002). (E) T47D cells were seeded in Matrigel-coated Transwell chambers and treated with 0, 50 or 100 ng/mL of rhNodal for 24 hours to assess cellular invasion. Cells exhibited a significant up-regulation of cellular invasion at 100 ng/mL rhNodal (n=3, p=0.0038). (F) BeWo+Nodal cells or BeWo+EV cells were seeded in Transwell chambers coated with Matrigel to assess cellular invasion after 24 hours. BeWo+Nodal cells exhibited elevated cellular invasion compared to BeWo+EV cells (n=3, p=0.022). (G) T47D cells were grown for 3 days in 3D culture using a bioreactor, and then seeded into collagen type 1 in order to assess 3D invasion over the course of 1 week. Cells treated with 100 ng/mL displayed a significant increase in 3D cellular invasion (measured by the distance cells invaded away from the edge of the cluster) compared to controls (n=10, p=0.032). (H) Representative image showing in vitro 3D collagen invasion assay with T47D cells as described in (G). Bar equals 50 μm and hatched lines delineate the cluster boarder. For all graphs, data are presented as mean ± S.E.M for replicate values. Different letters indicate a significant difference.
