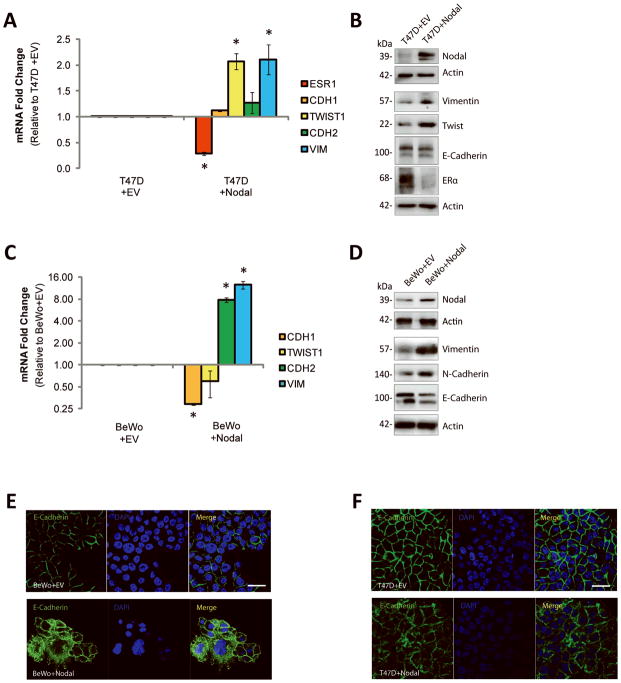
Figure 2. Nodal promotes EMT-like phenotypes in breast cancer and choriocarcinoma cell lines.
(A) Real time RT-PCR analysis of EMT markers in T47D+EV cells versus T47D+Nodal cells. T47D+Nodal cells displayed a decrease in ESR1 expression (n=3, p=0.030), and an increase in TWIST1 (n=3, p=0.036) and VIM expression (n=3, p=0.018) compared to T47D+EV cells. CDH2 and CDH1 expression did not change (n=3, p>0.05). (B) Western blot analysis validating changes presented in (A). β-Actin is used as a loading control. (C) Real time RT-PCR analysis of EMT markers in BeWo cells transfected with a Nodal expression vector (BeWo+Nodal) versus a control vector (BeWo+EV). BeWo+Nodal cells displayed a decrease in CDH1 expression (n=4, p<0.001), and an increase in CDH2 (n=4, p<0.001) and VIM expression (n=3, p<0.001) compared to BeWo+EV cells. TWIST1 expression did not change (n=4, p>0.05). (D) Western blot analysis validating changes presented in (C). β-Actin is used as a loading control. (E) Immunofluorescence (IF) showing localization of E-Cadherin (green) in BeWo cells or (F) T47D cells transfected with a Nodal expression vector versus a control empty vector. Nuclei are stained with DAPI (blue) and bars equal 20 μm. All IF was performed ≥3 times. Data in A and C are presented as mean ± S.E.M. for replicate values. Asterisks (*) indicate a significant difference compared to control cells as specified. Expression levels are normalized to HPRT1.

