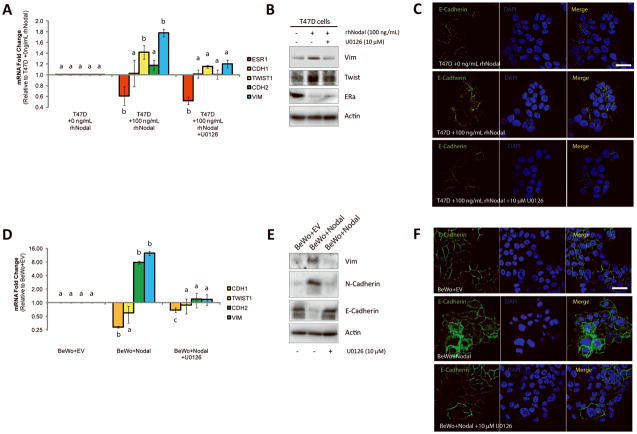
Figure 5. Nodal-induced EMT is mediated by ERK.
(A) Real time RT-PCR analysis of EMT markers in T47D cells exposed to 100 ng/mL rhNodal alone, or 100 ng/mL rhNodal + 10 μM U0126 (48 hrs). In response to 100 ng/mL of Nodal, T47D cells displayed a decrease in ESR1 (Estrogen Receptor) expression (n=4, p=0.029), and an increase in TWIST1 (n=4, p=0.029) and VIM (Vimentin) expression (n=4, p=0.029) compared to controls. CDH2 (N-Cadherin) and CDH1 (E-Cadherin) expression did not change (n=4, p>0.05). Treatment of T47D cells with U0126 prior to treatment with rhNodal rescued TWIST1 and VIM expression back to control levels, but did not rescue ESR1 Expression. (B) Western blot validating changes presented in (A). β-Actin is used as a loading control. (C) Immunofluorescence (IF) showing localization of E-Cadherin (green) in T47D cells treated with 100 ng/mL rhNodal, or 100 ng/mL rhNodal + 10 μM U0126. Nuclei are stained with DAPI (blue) and bars equal 20 μm. (D) Real time RT-PCR analysis of EMT markers in BeWo cells transfected with a Nodal expression vector (BeWo+Nodal) versus a control vector (BeWo+EV), or in BeWo+Nodal cells treated with 10 μM U0126 (48 hrs). BeWo cells expressing Nodal displayed a decrease in CDH1 expression (n=4, p<0.001), and an increase in CDH2 (n=4, p<0.001) and VIM expression (n=3, p<0.001) compared to BeWo+EV cells. Treatment of BeWo+Nodal cells with U0126 rescued CDH2 and VIM expression back to BeWo+EV levels, and significantly reverted CDH1 expression to near-control levels (n=4, p=0.029). TWIST1 expression did not change with any of the treatments. (E) Western blot analysis corresponding to changes presented in (D). β-Actin is used as a loading control. (F) IF showing localization of E-Cadherin (green) in BeWo cells transfected with a Nodal expression construct (BeWo+Nodal) or an empty vector control (BeWo+EV). BeWo+Nodal cells were also treated with U0126 (10 μM) to determine the effects of ERK signaling on Nodal-induced localization of E-Cadherin. Nuclei are stained with DAPI (blue) and bars equal 20 μm. Data are presented as mean ± S.E.M. for replicate values. Different letters indicate a significant difference compared to control treatments/genes as specified. Gene expression levels (measured by PCR) are normalized to HPRT1. All IF was performed 3–4 times.

