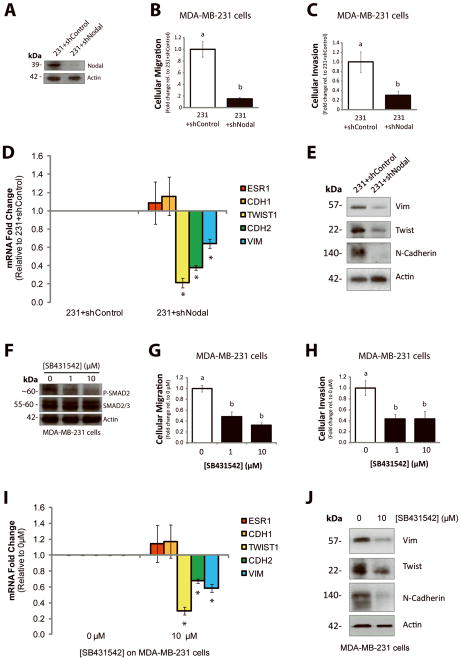
Figure 6. Nodal inhibition impairs invasion and migration in vitro.
(A) Western blot validating decreased Nodal expression in MDA-MB-231 cells transfected with a Nodal-targeted shRNA (231+shNodal) versus a scramble control shRNA (231+shControl). The pro-Nodal (~39 kDa) band is presented and β-Actin is used as a control. (B) Cellular migration and (C) invasion through Matrigel of 231+shControl versus 231+shNodal cells was quantified after 24 hrs. Cellular migration and invasion were significantly reduced in response to Nodal knockdown (n=5, p<0.02). (D) Real time RT-PCR analysis of EMT markers in MDA-MB-231 cells stably transfected with a Nodal-targeted shRNA (231+shNodal) or a scrambled Control shRNA (231+shControl). 231+Nodal cells displayed reduced expression of TWIST1 (n=3, p<0.001), CDH2 (n=3, p<0.001), and VIM (n=3, p=0.031). CDH1 and ESR1 were not significantly different between 231+shNodal cells and 231+shControl cells. (E) Western blot validating changes presented in (D). β-Actin is used as a loading control. (F) Western blot validating that treatment of MDA-MB-231 cells with SB431542 (0, 1, or 10 μM) causes a dose-dependent decrease in SMAD2 phosphorylation. SMAD2/3 and β-Actin are used as loading controls. (G) Cellular migration and (H) invasion through Matrigel of MDA-MB-231 cells treated with 0, 1 or 10 μM of SB431542. Cellular migration (n=5, p<0.001) and invasion (n=5, p=0.016) were significantly reduced in response to SB431542. (I) Real time RT-PCR analysis of EMT markers in MDA-MB-231 cells treated with SB431542 (0 or 10 μM, 48 hrs). In response to SB431542, MDA-MB-231 cells displayed reduced expression of TWIST1 (n=3, p<0.001), CDH2 (n=3, p<0.001), and VIM (n=3, p=0.001). CDH1 and ESR1 did not change in response to SB431542. (J) Western blot validating changes presented in (I). β-Actin is used as a loading control. Gene expression levels (measured by PCR) are normalized to HPRT1. All parametric data are presented as mean ± S.E.M for replicate values, and non-parametric data are presented as median ± interquartile range. Different letters indicate a significant difference compared to controls (open bars), and asterisks indicate a significant difference compared to controls (normalized gene expression).

