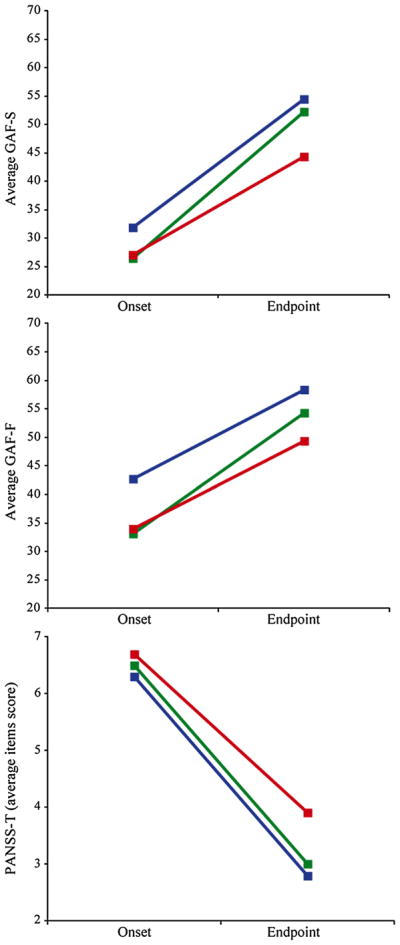
Fig. 2.

Change of GAF and PANSS from disease onset to endpoint for the two cognitively impaired clusters and the cluster with near-normal cognitive functioning. The GAF-S, the GAF-F and the PANSS were rated at disease onset and endpoint. PANSS scores were calculated in average item score. Briefly, the items of the positive and the negative subscales were rated, and a mean score for each subscale was calculated
